To support your DEI efforts, we’ve put together this comprehensive guide to DEI reporting. The guide is designed to enable you to gain insights into your diversity metrics and build transparency, and accountability, across your organization.
We hope this empowers you to turn data into action and gets us one step closer to the change we want to see. You can download the full guide below.
What data should you be looking at?
Getting started on your org’s DEI strategy can feel overwhelming. Developing a keen understanding of where you currently stand will help you chart out the best and most intentional course of action.
Gathering the necessary information and building dashboards help bring your data to life, making it easier to engage with other stakeholders and track progress over time.
We suggest looking at three main buckets: representation, compensation and performance.

1. Representation
Representation matters, both across the organization but also within the various groups that make up your company. Blanket percentages can be simple to convey and serve as nice vanity metrics – but don’t necessarily speak to real DEI efforts.
Consider looking at your employee makeup across these various cuts to help you think about representation holistically:
- Across the organization
- Within new hire cohorts
- Within each department
- Within role types (i.e. technical vs. non-technical, external vs. internal, administrative vs. non-administrative)
- Within office locations
- Within cross-functional project teams
- Within each management layer (i.e. executive, VP, director, manager, individual contributor, etc.)
- Within individual contributor levels (i.e. starting, mid-level, etc.)
Beyond looking at representation within management layers, you can also analyze level of responsibility by looking at the average span of control and the average team size (including those reporting into their direct reports).
Note for ChartHop Customers: you can use ManagerCount to denote the number of managers above the person, also referred to as the level from the CEO.
2. Compensation
Differences in compensation represent a huge driver of racial inequities across the board. Research shows Black men earn $0.87 for every dollar a White man earns. We recommend you look at:
- Base compensation – cash compensation; fixed salary or hourly wage
- Variable compensation – cash compensation; bonus, commission and other performance-related compensation
- Equity compensation – non-cash compensation; represents ownership in the firm, includes options and/or restricted stock units
- Total compensation – sum of cash and non-cash compensation (base + variable + equity)
- Raise amount – increase in Base compensation
- Other benefits – can include PTO, transportation benefits, 401k matching, health benefits, additional subsidies, etc.
- Percentile within band- denotes percentile within set compensation bands/level set
It’s really important that you look at total compensation, not just cash compensation – base & variable. As tech becomes one of the greatest engines of wealth creation through equity ownership, many historically underrepresented groups have not been part of those gains. There are massive disparities that need to be addressed – ChartHop’s Charting Better Workplaces 2020 report shows that men have 63% more ownership in a company than woman. While women make up 40% of ownership, hey only own 21% of shares.
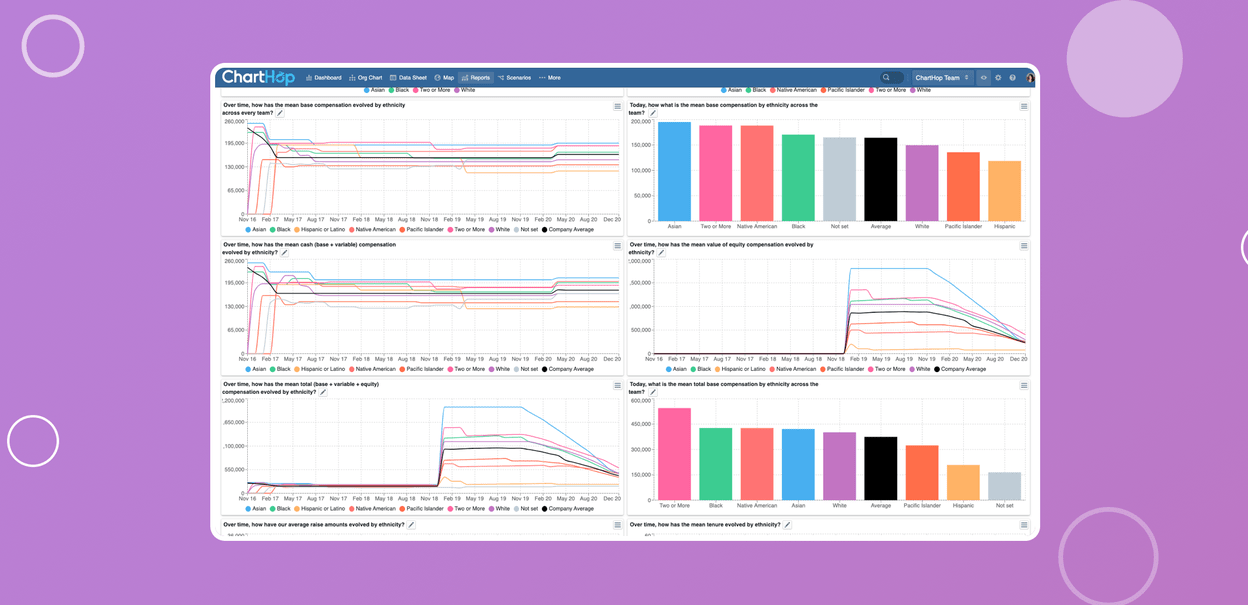
In ChartHop, you can easily centralize data from across your payroll and equity systems to get a clear view of what total compensation across groups looks like. This provides your team with the data insights needed to drive change, without needing to hire external parties to conduct an analysis.

This is a sample report of cash (base + variable), equity, and total (cash + equity) compensation by race and ethnicity, including the company average.
To effectively drive change, it’s critical to understand the numbers within context. For example, if you only have Black employees in entry-level positions, average compensation for Black employees is going to be lower than other groups. Thus, the answer is not to give Black employees raises but rather to hire Black professionals in higher paying, leadership roles. On the other hand, looking at this data within levels/roles might help identify any pay discrepancy or pay gaps which would benefit from adjustments or raises.
More importantly, be proactive with this data. It’s not only helpful in understanding past decisions made, but it can and should be actively used to make better, future decisions.
Ensure these reports are leveraged when doing internal mobility reviews, promotion cycles as well as compensation and equity reviews. Empower frontline managers and leaders with this data when they are conducting compensation proposals and promotion recommendations. Analyze the proposed changes on a micro and macro scale before the changes are final and approved.
Through all of this, remember that systemic inequities result in less negotiating power for people of color. If you have bands or levels set up, you should look at where individual people stand within the range and the average for groups of people.
3. Performance
When we think about performance, we think about both how the employee is performing (i.e. performance ratings, OKR achievements) and how the company is performing in supporting their employees (i.e. employee engagement).
3.1. Reviews
Performance review data should inform compensation reviews – promotions and raises should never be done in a vacuum. But what happens if your performance reviews themselves are biased? According to The Atlantic:
African American employees tend to receive more scrutiny from their bosses than their white colleagues, meaning that small mistakes are more likely to be caught, which over time leads to worse performance reviews and lower wages.
Calibrate your performance data across race/ethnicities and gender to uncover any biases. Within ChartHop you can map the final composite rating across different groups and easily identify any significant disparities.
When it comes to self reviews, research shows that some cultures tend to underplay their strengths while others overplay them. Keep this in mind when calibrating reviews across the board, as those who judge themselves harshly, will often do the same for others. Take a look at:
- Downward reviews – Reviews written by direct, indirect managers to reports. May also include reviews from up the management chain.
- Upward reviews – Reviews written by direct or indirect reports to their managers. May also include reviews up the management chain.
- Peer reviews – Reviews written to/from any colleagues who are not direct managers or direct reports.
- Self reviews – Reviews written by the individual reflecting on their own work and growth.
- Average time to promotion
- Number of promotions
It isn’t enough to get Black employees into your company – it’s also providing opportunities for internal mobility. As shared earlier, history shows that performance ratings and promotions aren’t objectively evaluated – they can be based on visibility or unconscious biases. Ensure you’re keeping an eye on these numbers to support equitable practices. Have clear and objective guidelines for what is expected to get a promotion and provide mentorship programs and/or training to support this internal mobility.
3.2. Employee Engagement
When it comes to retention and engagement, collecting this information can uncover systemic cultural issues within your organization. Especially in times of crisis, and especially in remote organizations, it is important to acknowledge that personal circumstances affect groups differently. Building diverse teams is important, and it’s equally important to ensure inclusive cultures that foster equitable practices.
Management training is really important here – ensure that managers are continuously checking in and tracking employee sentiment over time. At an aggregated level, using different dimensions to analyze this data can signal that you need to provide additional support to certain groups of employees. Measure the below across race/ethnicity and gender:
- Employee NPS / engagement ratings
- One-on-one ratings

This is a sample report showing how you can spot trends in average weekly one on one ratings by race and ethnicity and drill down to see individual employees.
3.3. Employee Turnover
As you evaluate your culture and ways to better support and cultivate a diverse team, turnover (or attrition rates are critical). High turnover is expensive. Analyzing this data across dimensions can alert you that there’s something either wrong with your culture or with your hiring process. Analyze the below by race/ethnicity and gender:
- Average tenure
- Turnover rates
Turnover rate can be further dissected by level/role, department and even by manager. Total regrettable turnover rate – employees who left the company but who the company had planned to retain – can be particularly telling. As you track regrettable vs. non regrettable, challenge the assumptions around these – they may very well be seeped in unconscious biases, as well. We recommend a process whereby managers and HR jointly define this.
For further context, it’s also valuable to marry the above data with qualitative input such as exit surveys (written and verbal).
Next step: Understand your data
Once you define and collect the data you want to track, it’s time to centralize it and analyze it to fully understand it.