As an HR professional, you work hard to keep the employee experience—everything from recruitment to promotions to the day-to-day—as bias-free as possible, but it can be difficult. After all, we all have biases, whether we realize it or not.
Addressing implicit bias requires that individuals work to identify their own biases and ways to overcome them. At work, this means taking a hard look at your policies and practices and being honest about where and how those practices perpetuate bias. Workforce analytics can help.
With workforce analytics, your team can identify where implicit bias exists in your hiring practices, promotion decisions, and your employees’ daily experiences. In doing so, you’ll better position your team to beat those biases with targeted action.
What is implicit bias?
Implicit bias refers to attitudes or stereotypes that influence our understanding of a person or group of people on a subconscious level.
Implicit biases develop over the course of our lifetimes. They are embedded in our ways of thinking through iterative queues from our upbringing and culture. Unlike explicit bias — which refer to conscious forms of discrimination like intentionally not hiring someone because of their race, age, gender, etc. — implicit bias emerges involuntarily and without us even realizing it.
While implicit bias operates on a subconscious level, its real-world implications can be just as discriminatory as explicit bias. Understanding and making plans to address implicit bias can make a big difference in creating an inclusive environment for underrepresented minorities at your org.
Use workforce analytics to shore up your recruitment and hiring practices
When it comes to recruitment and hiring practices, the influence of implicit bias is far-reaching. From a reliance on traditional recruiting sources to quickly weighing candidates based on their name, judgment can take many forms.
Network and employee referrals are a popular source of hire for companies, and research finds referred employees often have greater engagement and satisfaction on the job. Many companies rely on referrals to help bring in diverse candidates, but if a workforce lacks diversity, then employee referrals run the risk of bringing in more of the same type of employee. Research supports this idea, finding that, at the end of the day, referrals still largely favor white men.
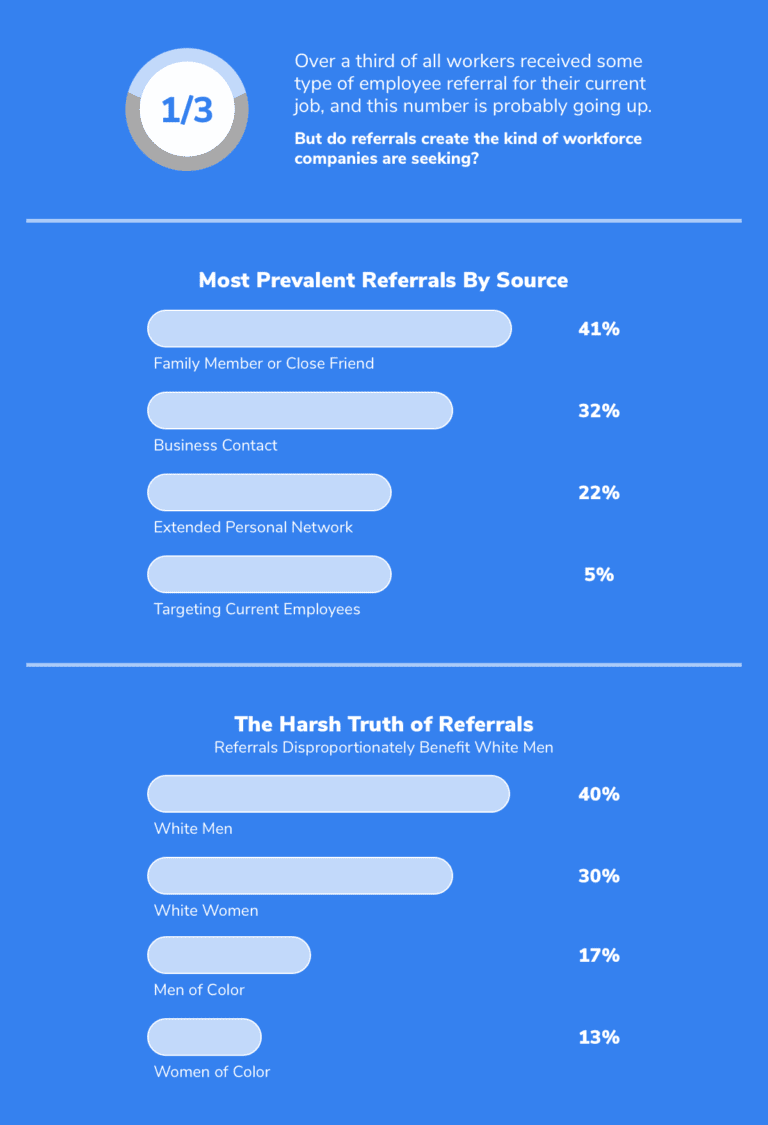
While referrals can bring in diverse candidates, they’re found to largely benefit white men. (Source)
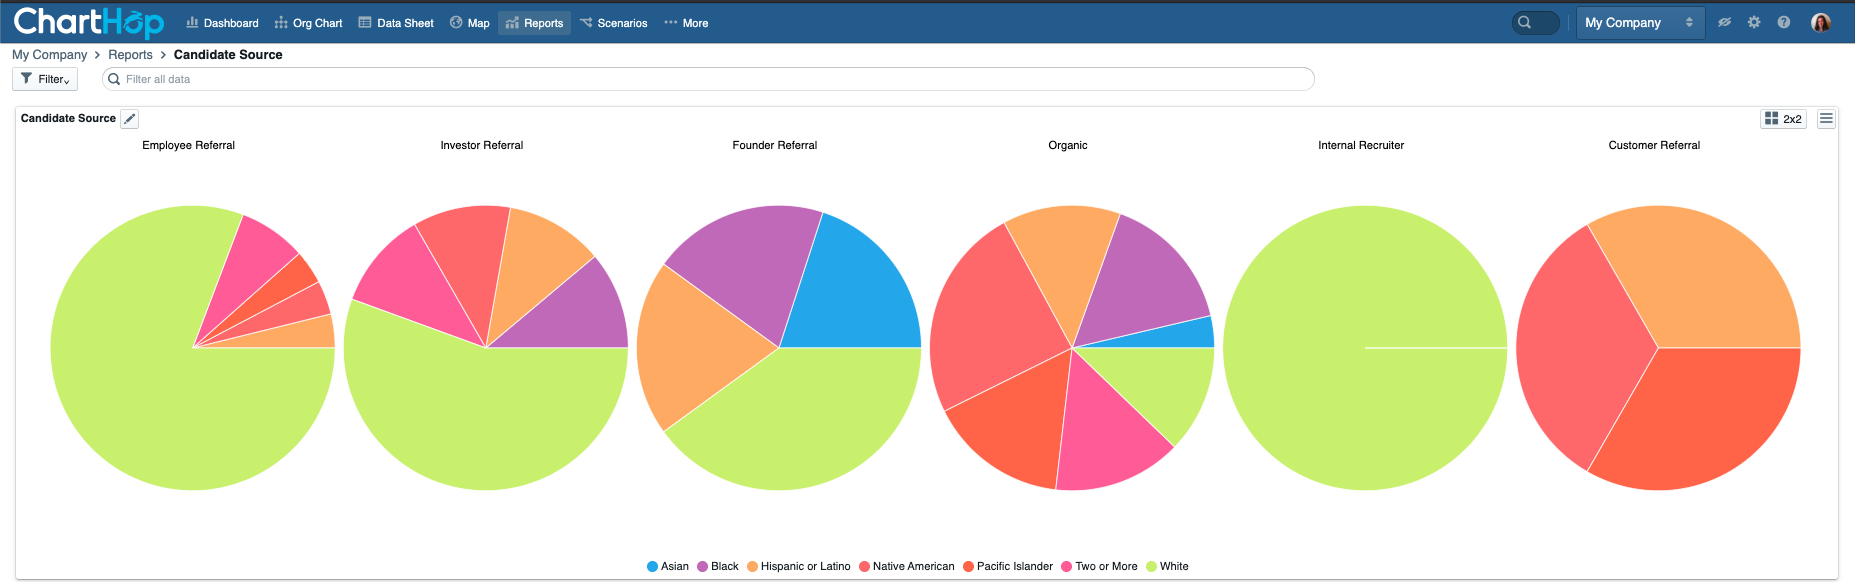
So how do you determine if your referrals reflect bias? With ChartHop. We transform your referral data sets into easy-to-understand visuals that empower you to take action. For companies committed to bringing in diverse referrals, this may look like implementing or restructuring a referral bonus program that rewards employees who refer diverse candidates.
You may also consider whether your referral sources are diversified. If your company relies on traditional job posting sites or recruitment events, you may be unconsciously limiting your applicant pool.
To fight potential bias, widen your sources. Job sites like Tech Ladies, PDN Recruits, and VetJobs can help you build a more representative pipeline by bringing in more diverse applicants.
Take a data-driven approach to identify bias
Companies can also review important KPIs to identify trends over time, like if your company has made progress toward specific diversity hiring goals.
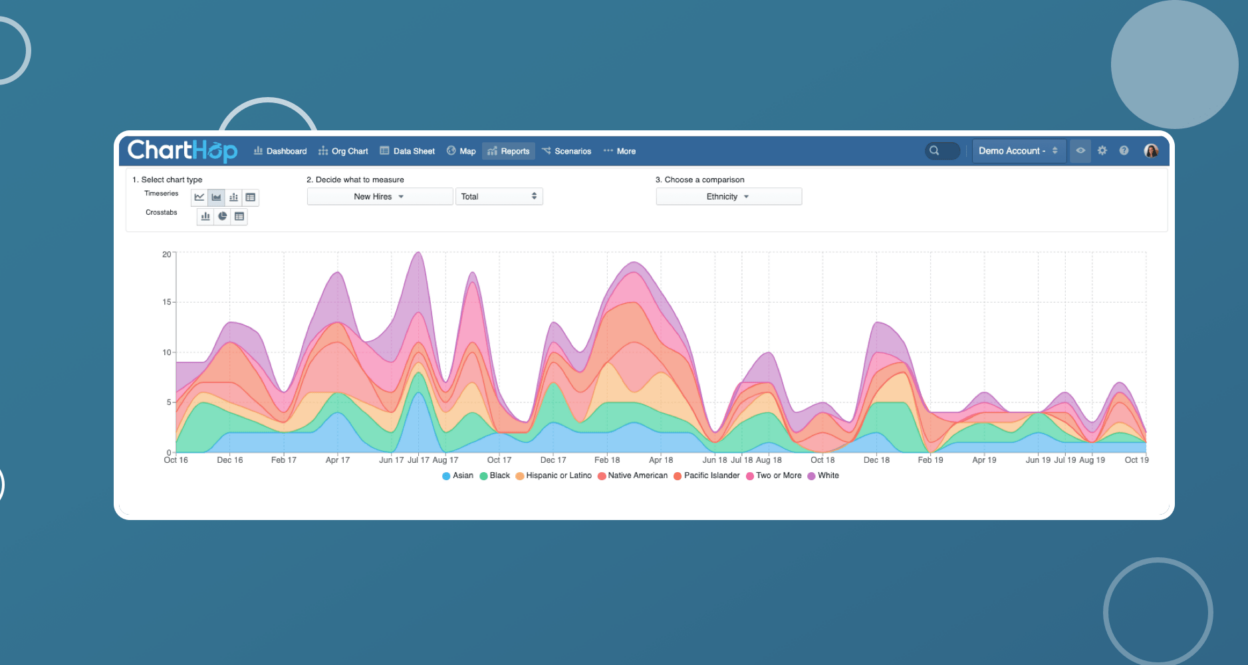
For example, examine new-hire data by hiring manager or recruiter. Doing so helps you identify those who may be unconsciously (or consciously) hiring a specific type of employee. ChartHop makes this visualization easy. With a few clicks, you can drill into new-hire data and see, by manager or recruiter, the demographic trends of their hires.
A depiction of a racially biased referral process.
Tools like ChartHop help you level up your data game. ChartHop uses integrations with popular applicant tracking systems, human resources information systems, and payroll and benefits management systems to help you centralize your people data. Because data (and changes to data) automatically flow into ChartHop, you know that you’re running reports and reviewing trends that reflect the most current information available.
Use tools designed to remove bias
As companies commit to diverse hiring, some might seek out tools designed to help them tackle bias in their recruitment and vetting process.
Startup Blendoor, for example, masks identifying information on resumes and applications. It can help employers target diverse hiring sources, and lets companies see how diverse candidates move through the hiring process.
Say an HR director notices that several candidates drop out at a specific point in the process. When they examine the phase more closely, they realize the issue might be with a hiring manager. At that point, they may choose to meet with the manager or maybe schedule the manager for implicit bias training.
Many companies also rely on services like Textio, which helps hiring managers compose job descriptions free of biased words and phrases.
“Textio analyzes hiring outcomes data from more than 250 million real-world job posts to score a job listing and give actionable feedback as you are writing in real time,” says co-founder and CEO Kieran Snyder.
On average, customers who follow Textio’s guidance and score above a 90 in Textio see 25% more candidates qualified enough to interview [and] 23% more applications from women, and they fill roles 17% faster.
Kieran Snyder, CEO @ Textio
Google used a similar process to remove biased language from their job postings and saw an 11% increase in applicants who are women from 2019 to 2020.
Use data to ensure equal advancement opportunities for all employees
Managers play a key role in promoting employees, assessing their performance, and shaping their experience. If a manager has even the slightest implicit bias, their judgments and actions can have significant and long-lasting impacts on their employees’ careers.
TRACK PROMOTIONS BY GENDER AND RACE
Advancing one’s career continues to be a struggle for women and minorities. In a McKinsey study, they found that for every 100 men promoted to manager, only 85 women advanced. That number was even less for women of color.
McKinsey refers to this as the “broken rung”—that essential promotion from individual contributor to manager that can lead to more senior leadership positions. Without it, women fall out of the advancement pipeline.
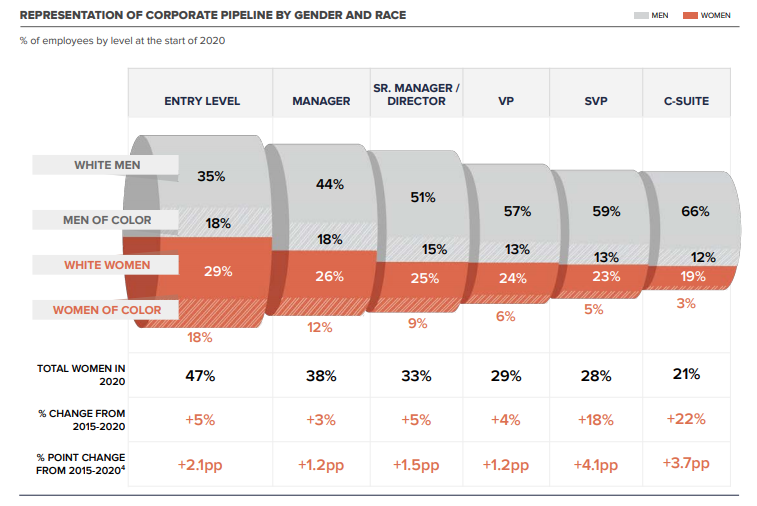
While numbers have gone up in the last five years, women and minorities still do not advance at the same rate as the male majority. (Source)
Companies have been known to promote a majority of white men based on potential, whereas women and minorities are awarded positions based on experience. This behavior feeds the “prove it again” bias, the often unconscious expectation that women and minority employees readily supply evidence of their competence. In a survey of bias in engineering, 68% of respondents of color (men and women) stated that they had to continually prove themselves, while only 35% of white male engineers felt similar.
Consider mentorships. They are largely known to contribute to employees’ professional growth, yet only 36% of women of color said their managers took an interest in their advancement. Two biases could be in play here: the employees feel they must prove their competence to overcome that lack of mentorship support, and management may be unconsciously choosing to mentor employees whose experiences or backgrounds mirror their own.

When the company realizes it has a race problem, it sets a plan into action to hire and promote diverse candidates
Is there implicit bias in how your company promotes employees? ChartHop can help you uncover it. Multiple data visualizations help you track promotion by desired demographics or grouped demographics, like underrepresented minority groups (URMs). And with our org chart views and time travel tool, you can easily follow employee movement through your company.
When you track promotions and pay data alongside your diversity and inclusion strategies, you hold yourself accountable to your employees. You are better equipped to identify inequality, and you can uncover existing bias in your promotion practices.
REVIEW ASSESSMENTS TO ENSURE FAIRNESS
When it comes to reviews, using open-ended questions may invite reviewers to elaborate on what an employee is doing well or where they can improve. But it can also invite bias.
In a study that looked at 4,344 performance reviews, researchers found that reviewers more often used positive words to describe men and negative words to describe women. Another study found that reviewers mentioned mistakes in 43% of reviews of minority employees. Reviewers only mentioned mistakes in 26% of reviews of white men.

Performance reviews for women contained more negative words than performance reviews for men. (Source)
Uncover potential bias in performance reviews by viewing a breakdown of reviews by race, gender, or race and gender. It’s possible with tools like ChartHop. However you structure your reviews—a 5-to-1 scale or a below, meets, or exceeds expectations scale—quickly see how ratings are assigned by certain demographics.
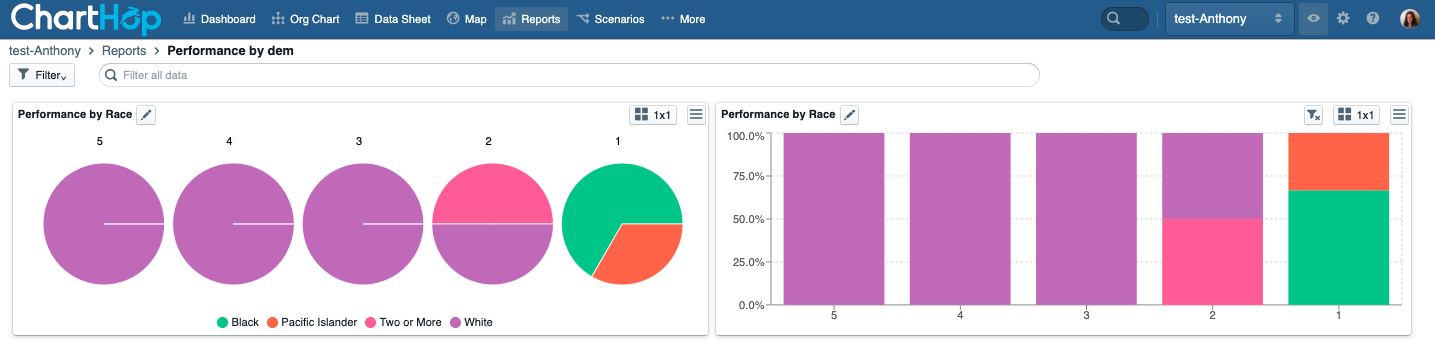
Racially biased performance review scores on a scale of 1-5 (5 being the highest)
See a trend? Drill into the data and get to the source. It might be a manager letting their implicit bias affect their reviews of members of their team. Training could play a huge role in reducing these biases. Helping managers understand how the company measures quality of work or customer impact can significantly improve managers’ ability to assess employees consistently. Additionally, using pre-defined criteria for employee evaluations can lessen bias when assessing performance.
Another way to combat bias is to measure performance using concrete metrics that can be applied to all employees fairly. For metrics that seem broad—like productivity or time management—get specific about what you’re measuring. You can also consider instituting 360-feedback practices. Inviting feedback from managers, co-workers, and those who might report to the employee can present a more accurate assessment of their performance or reveal inconsistencies and potential bias.
Use Analytics to Understand Engagement
Companies that report higher levels of employee engagement and diversity see higher financial performance in their industry. On the flip side, companies that struggle with inclusivity see higher turnover and have difficulty retaining diverse talent. For the tech industry alone, this turnover costs over $16 billion annually.
In a study of why employees voluntarily leave jobs in tech, 40% of men of color cited leaving because of unfairness. And they weren’t alone. Women of color and LGBTQ employees also cited unfairness as a reason for leaving. Even employees who witnessed unfair treatment (85%) cited it as a reason for leaving. This treatment included bullying, stereotyping employees, inappropriate comments or behavior, and an overall toxic work environment.
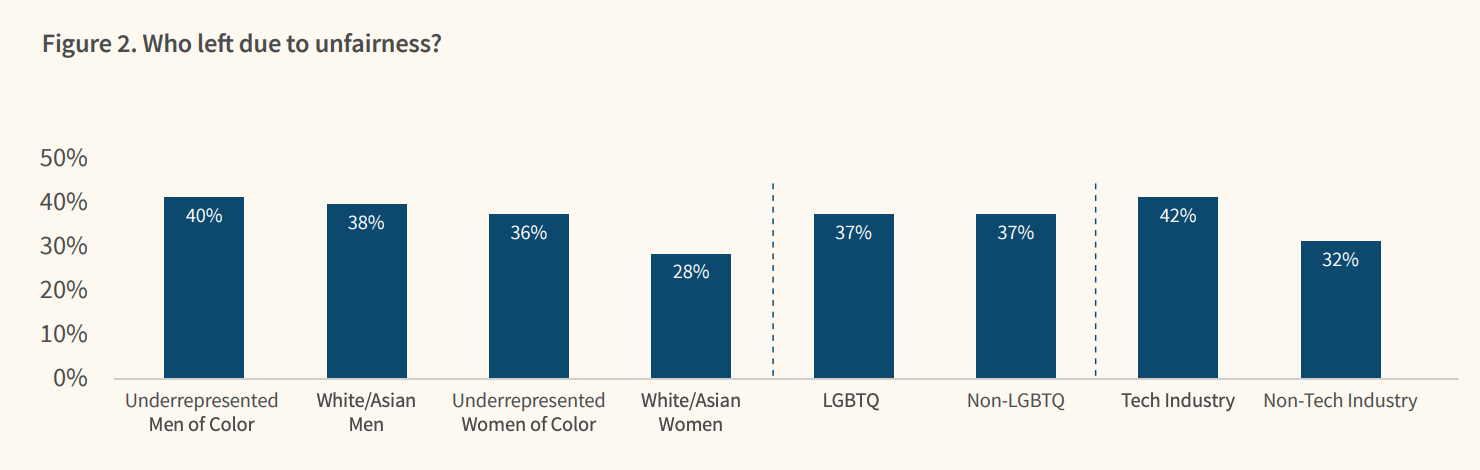
Men and women of color and LGBTQ employees cited unfair treatment or behavior in the tech industry as a reason for leaving their job. (Source)
Analytics can help you dial into your employees’ experience
The simple but hard truth is every employee at your company experiences work differently. How could they not when they each bring with them such unique backgrounds and experiences? But don’t be discouraged—analytics make it easier to understand your employees’ day-to-day work experience.
For example, very few companies take an [intersectional approach](/platform/dei/ to their metrics, that is, assessing elements like gender and race together and not one over the other. That granular level of insight is essential in understanding the unique experiences of women of color and non-binary employees: how they connect with their co-workers, grow professionally, and what support they need to succeed.
Measuring specific metrics like employee engagement, satisfaction, retention rate by team or manager, and voluntary turnover can help you identify areas of concern and implement policies to address them.
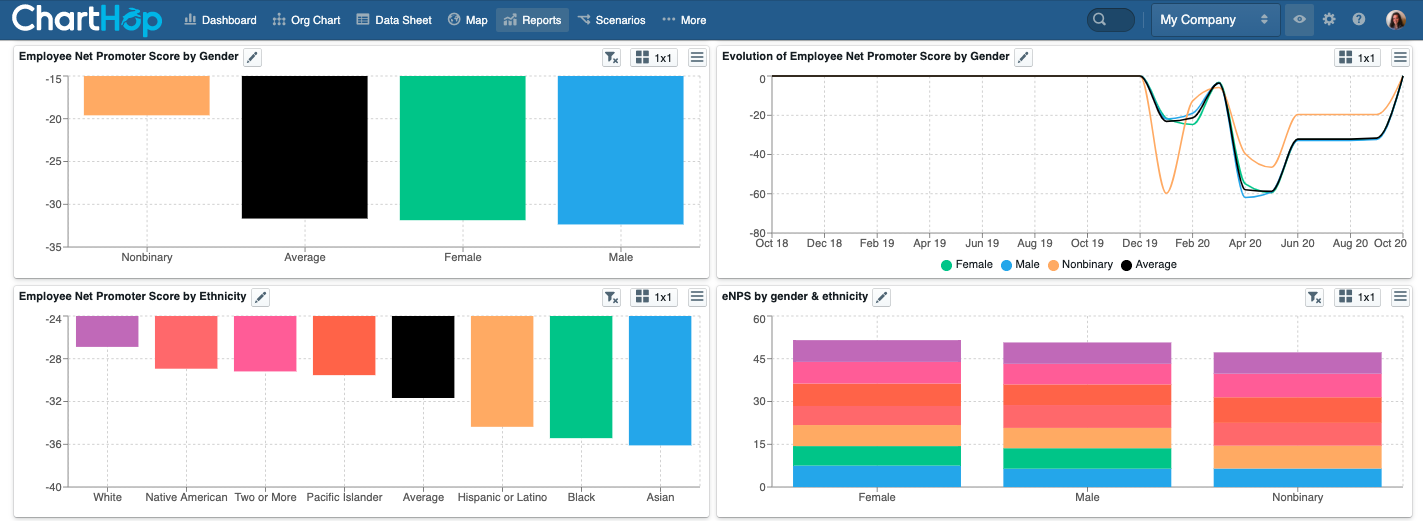
Visualization of ChartHop’s eNPS reporting capabilities
Custom surveys and employee Net Promoter Score (eNPS) assessments can help you measure employee engagement. Findings can help you gauge employees’ thoughts on leadership, company culture, opportunities for growth, and company policies and practices.
For example, ChartHop makes visualizing eNPS trends over time easy. You can break out data by gender, race, role, and level within your organization. Take advantage of our preconfigured eNPS survey, or use an existing integration to bring that data over and drill into the details.
Qualitative data, or answers you get with open-ended questions, focus groups, or one-on-one interviews, can also help you understand the employee experience and how bias might manifest.
For example, when it comes to the distribution of tasks, several women at your company may report they’re repeatedly assigned “office housework,” like scheduling meetings, taking notes, and planning team or office events. It could be that their managers don’t even realize they’re assigning tasks this way, but drawing attention to this experience can help ensure that, moving forward, managers regularly rotate “office housework” around their team.
Numbers Only Take You So Far
Workforce analytics can shine a light on potential problems within your company, and numbers can play an important role for orgs committed to taking necessary action. Pair your findings with concrete steps to correct the problem, like masking applications and adopting 360-feedback practices for reviews. Sharing your data with key internal and external stakeholders can be a powerful way to take accountability for your plans.
Only by identifying and addressing implicit bias will you help your company make meaningful progress toward the data you wish to see and a workplace where employees can thrive.