

Have you heard the parable “The Fox and the Grapes”? Short story shorter, a hungry fox stumbles upon a vineyard and wants the grapes for supper. These grapes are high off the ground. The fox decides climbing is too much work, tells himself they’re probably sour anyway, and leaves with an empty stomach.
Consider if the fox practiced reaching those grapes. Through trial and error, he’d most likely discover the best way to the top of those vines. And the new skill wouldn’t just benefit him that night; he’d reap the rewards of his hard work for the rest of his life.
You can probably determine the moral of the story, but we’ll lay it out for you anyway: People often convince themselves the work is too hard or downplay the outcome when, in fact, a little effort could lead to beneficial, long-lasting results.
Along those lines, People teams can often feel overwhelmed with the idea of collecting, analyzing, and using data. That’s because gathering and computing HR metrics, as well as creating and tackling action items, can seem like a tall order for one department.
However, using data will provide insights into your employee experience, which will drive positive change at an individual, team, and company-wide level. And once you develop a system that is effective for you and your people, using HR metrics will not only become habitual, but you’ll immediately begin creating an optimal employee lifecycle and experience the rewards across the organization.
The employee lifecycle refers to the different phases an employee moves through during their time at your company. It also takes into account the role your People team plays in advancing employees’ careers in your organization.
Five distinct phases of the employee lifecycle are:
Due to the huge shift towards hybrid and remote work, companies can now hire from an increased talent pool. Tim White of Fujitsu, one of many leaders that seized this opportunity, explains, “We were fighting for talent, and all of a sudden these boundaries and borders have opened.”
Of course, this also means candidates may have more opportunities and offers, leading them to compare aspects like total compensation and company culture.
That’s why it’s so important for companies to prioritize their employee lifecycle and make data-driven decisions to improve the employee experience.
But if tackling your whole employee lifecycle feels overwhelming, don’t worry. Instead of creating a long to-do list, view the five employee lifecycle stages as individual spaces in which you can develop or improve the employee experience. With HR metrics to guide you, you’ll create an employee lifecycle that makes your company even more attractive to future candidates.
Tracking your recruitment efforts is an important metric to assess how much time, money, and resources your company invests during this phase. It can also help you identify if you’re hiring the right people at the right time.
One of the simplest HR metrics to do this is time-to-fill.
Time-to-fill refers to how long it takes for you to fill an open role. It encompasses the entire hiring process, from when a position is created to when a candidate accepts your offer. Traditionally, calculating time-to-fill simply requires adding up the number of calendar days of all your vacant jobs, then dividing by the number of positions filled.
Below is a simple formula:
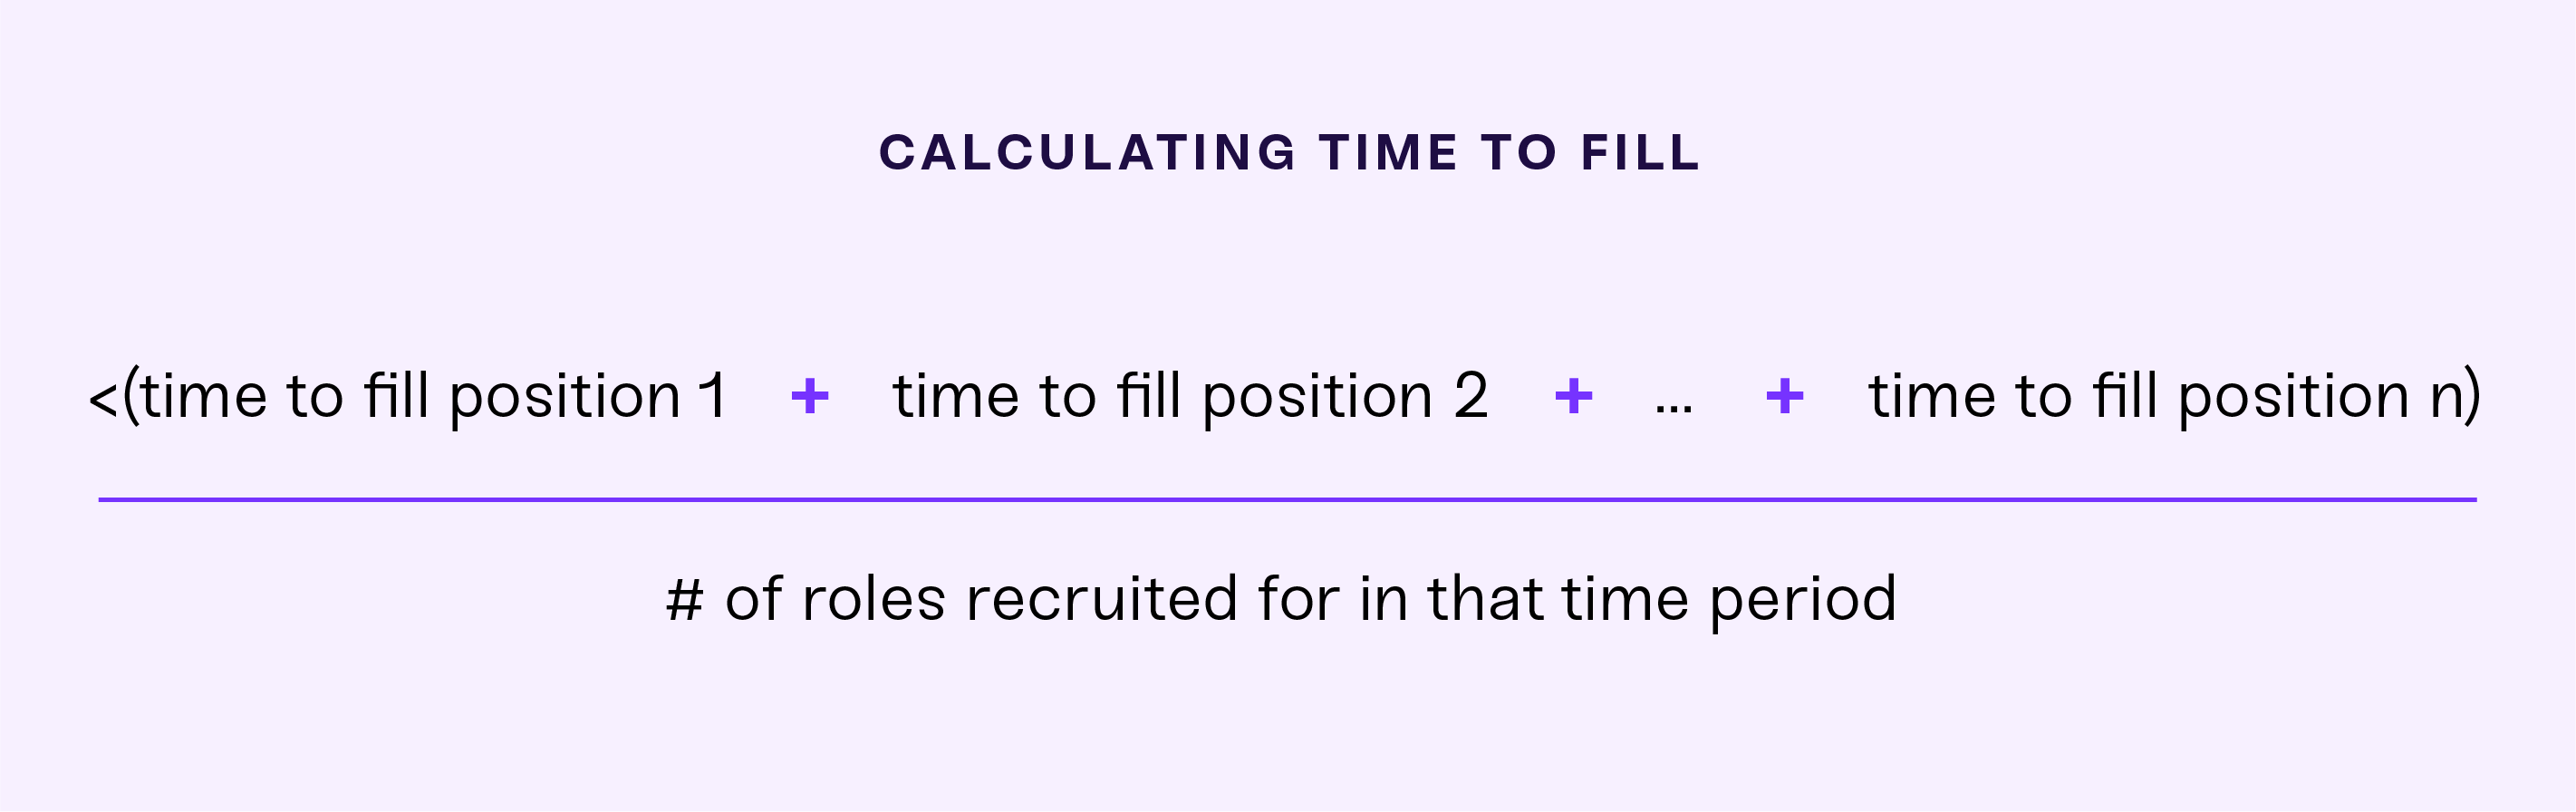
For attraction and recruitment, time-to-fill is a critical metric. It can help recruitment teams better understand their employer brand, sourcing strategies, and talent acquisition processes. If time-to-fill is particularly high, you will need to reconsider your efforts and determine next steps.
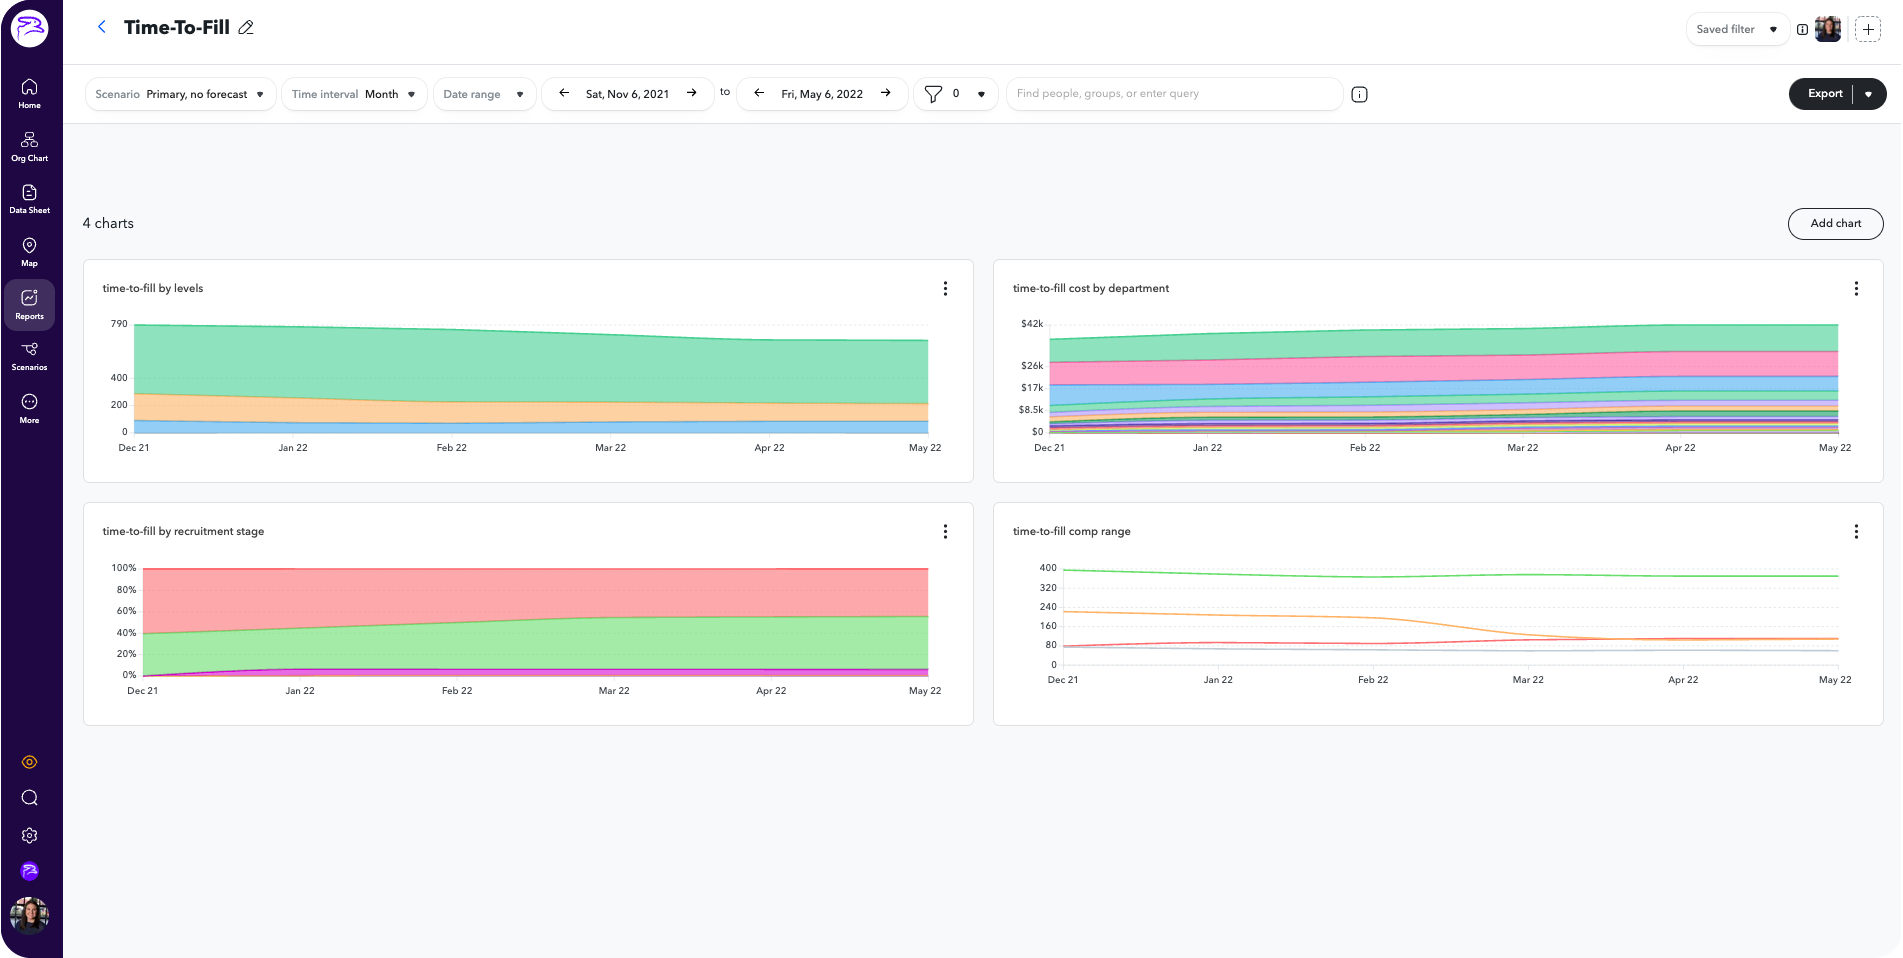
Comparing your time-to-fill metrics by aspects like level, department, and compensation range will help you make informed decisions moving forward.
Time-to-fill also helps team leads better manage their people. One way you can use this metric is to help inform planning and division of labor until a new candidate is hired. With the right people operations platform, managers can view how long it took to fill past roles to predict filling a current or future one.
Knowing this helps leads determine if their team has the bandwidth and resources needed to work efficiently until a new employee is hired. If they do, great. If not, it’s time to readjust work loads or press pause on some projects until a new person joins the team.
You can also use this HR metric to help recruiting managers pinpoint where assistance is required in the talent acquisition process. Ai-Mei Zhu, Manager of Talent Acquisition at ChartHop, meets with her team weekly to focus on metrics and offer help where needed. “After initially looking at data, I quickly realized that time-to-fill fluctuates on the level of the role,” she explains.
She therefore lends a hand when her team is recruiting for a leadership position that requires a specific skill set. She continues: “When filling a role is taking longer than expected, I source off-hours for the specific recruiter to provide extra support. Our company also invests in sourcing tools for targeted campaigns for candidates to lessen our time-to-fill and find the best person to fill the position.”
It’s not news that first impressions make a lasting impact. If your Talent Acquisition team already made a strong one during the recruitment process, you’ll want to ride that wave to further solidify your new employee’s positive experience. If there were some hiccups during the hiring process, it’s time to double down and prioritize your new hire.
That’s because employees form judgments of a new company’s behavior right when they join the organization. Negative experiences are highly influential; in fact, “20% of turnover takes place in the first 45 days,” warns Michelle Smith, vice president of Marketing for O.C. Tanner. This jaw-dropping number is linked to organizations’ lack of transparency about role expectations, cultural norms, and networking within the company.
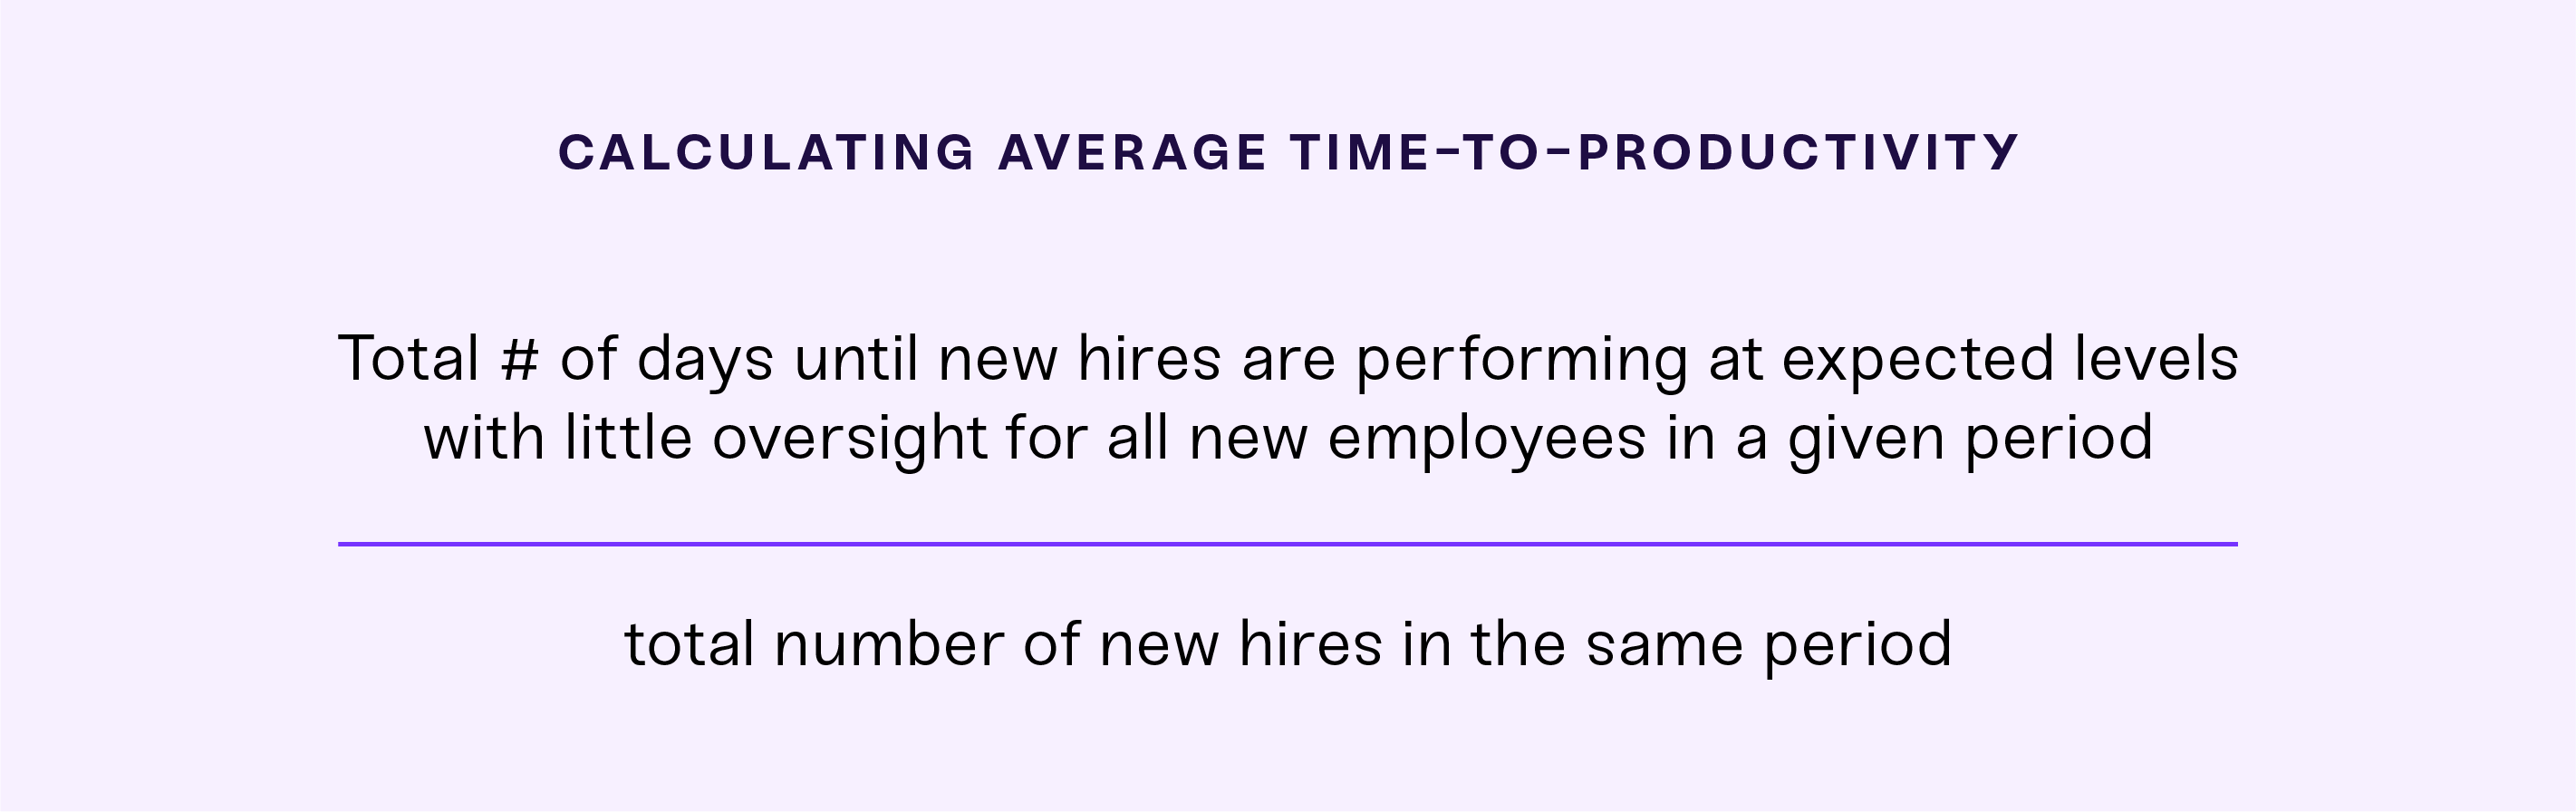
All of this said, having HR metrics available to create a data-driven onboarding strategy is crucial for avoiding early turnover. A simple metric to better understand the onboarding phase is time-to-productivity, which allows you to see exactly how fast it takes your new hires to achieve expected output.
The first step in calculating time-to-productivity is identifying at what point new hires perform tasks independently. You can set these expected output goals at 30-, 60-, and 90- day intervals to better track successes and areas for improvement within your onboarding process.
Once you’ve determined where you want your employees to be at those check-in points, you can calculate time-to-productivity.
A low time-to-productivity means your hiring practices are working and you’re hiring the right candidates. A high one means something needs to change. This may look like creating a standardized plan for onboarding, analyzing your candidate sourcing practices, or diving into performance reviews to note any patterns.
To help clarify your time-to-productivity metrics, you should also survey employees to learn about their preboarding and onboarding experiences. Consider asking the following:
When employees add their narrative to the data, you can gain further insight and create a more well-rounded preboarding and onboarding experience for future employees.
The Development phase, which begins after your employee’s first 90 days, prioritizes training and ongoing professional development across all levels. At this point, you need to provide opportunities for professional growth and ensure your people have the resources they need to achieve their goals.
Additionally, employees should always have a clear path towards the next step in their career. Consider embedding these discussions within ongoing 1:1s with managers, quarterly performance reviews, and professional workshops.
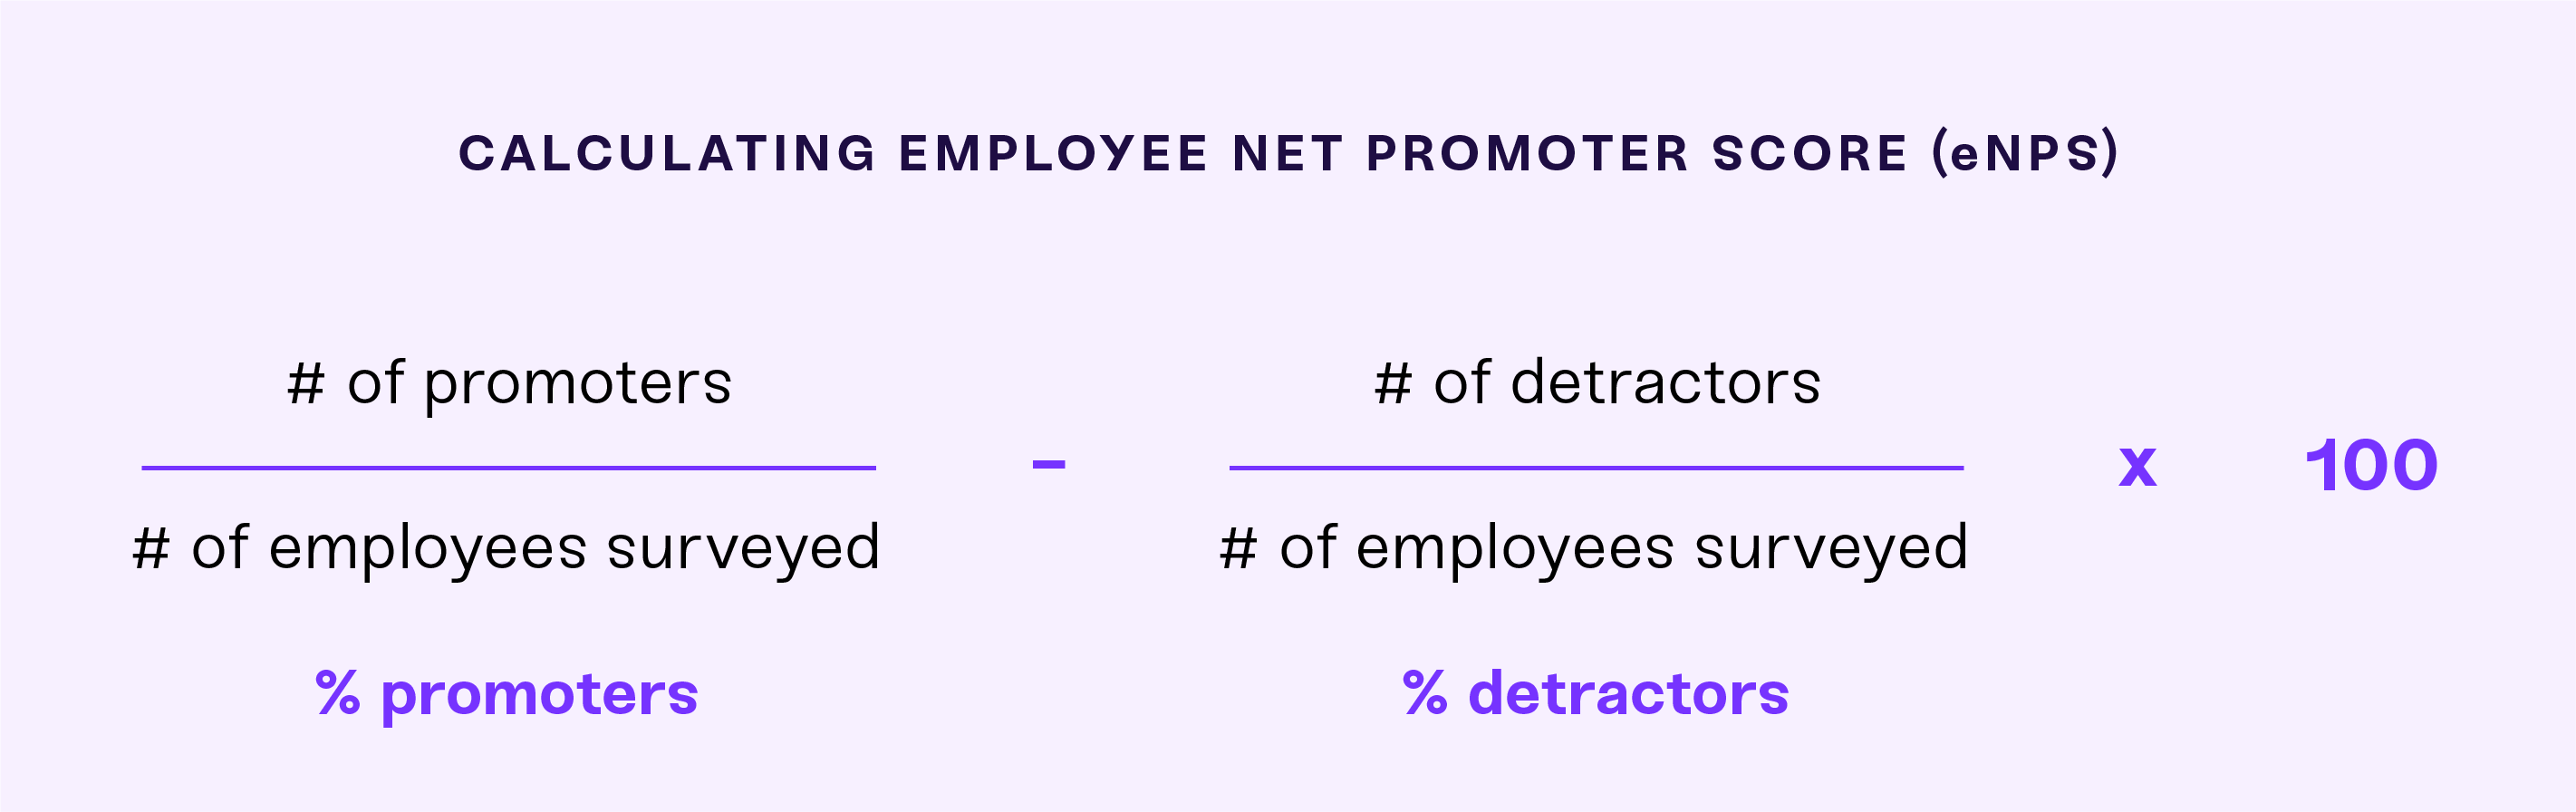
Furthermore, leaders should examine results from engagement surveys, eNPS audits, and 360-reviews to see if improvement efforts result in higher employee satisfaction.
While employee engagement is great for employees (no surprise there!), it also benefits your organization. An engaged workforce ensures increased adaptability, higher revenue, better decision-making, and greater opportunities for growth. Highly engaged teams also show 21% greater profitability, proving that engagement is more than sharing memes with your colleagues or turning your camera on during virtual meetings.
Your leadership team should therefore routinely access your eNPS data to enhance strategic decision-making around professional development, skills mapping, career pathing, and managerial training. Furthermore, viewing your metrics in a people operations platform that allows you to cross-examine your information helps flag trends and potential risks that will affect your workforce and employee lifecycle in the future.
In the example below, you can quickly see that employees who identify as nonbinary, as well as those from Gen-Z, have a lower eNPS score than their colleagues. Executives and team leads should use this information to address any immediate issues and develop a game plan moving forward to ensure all employees feel valued at the company.
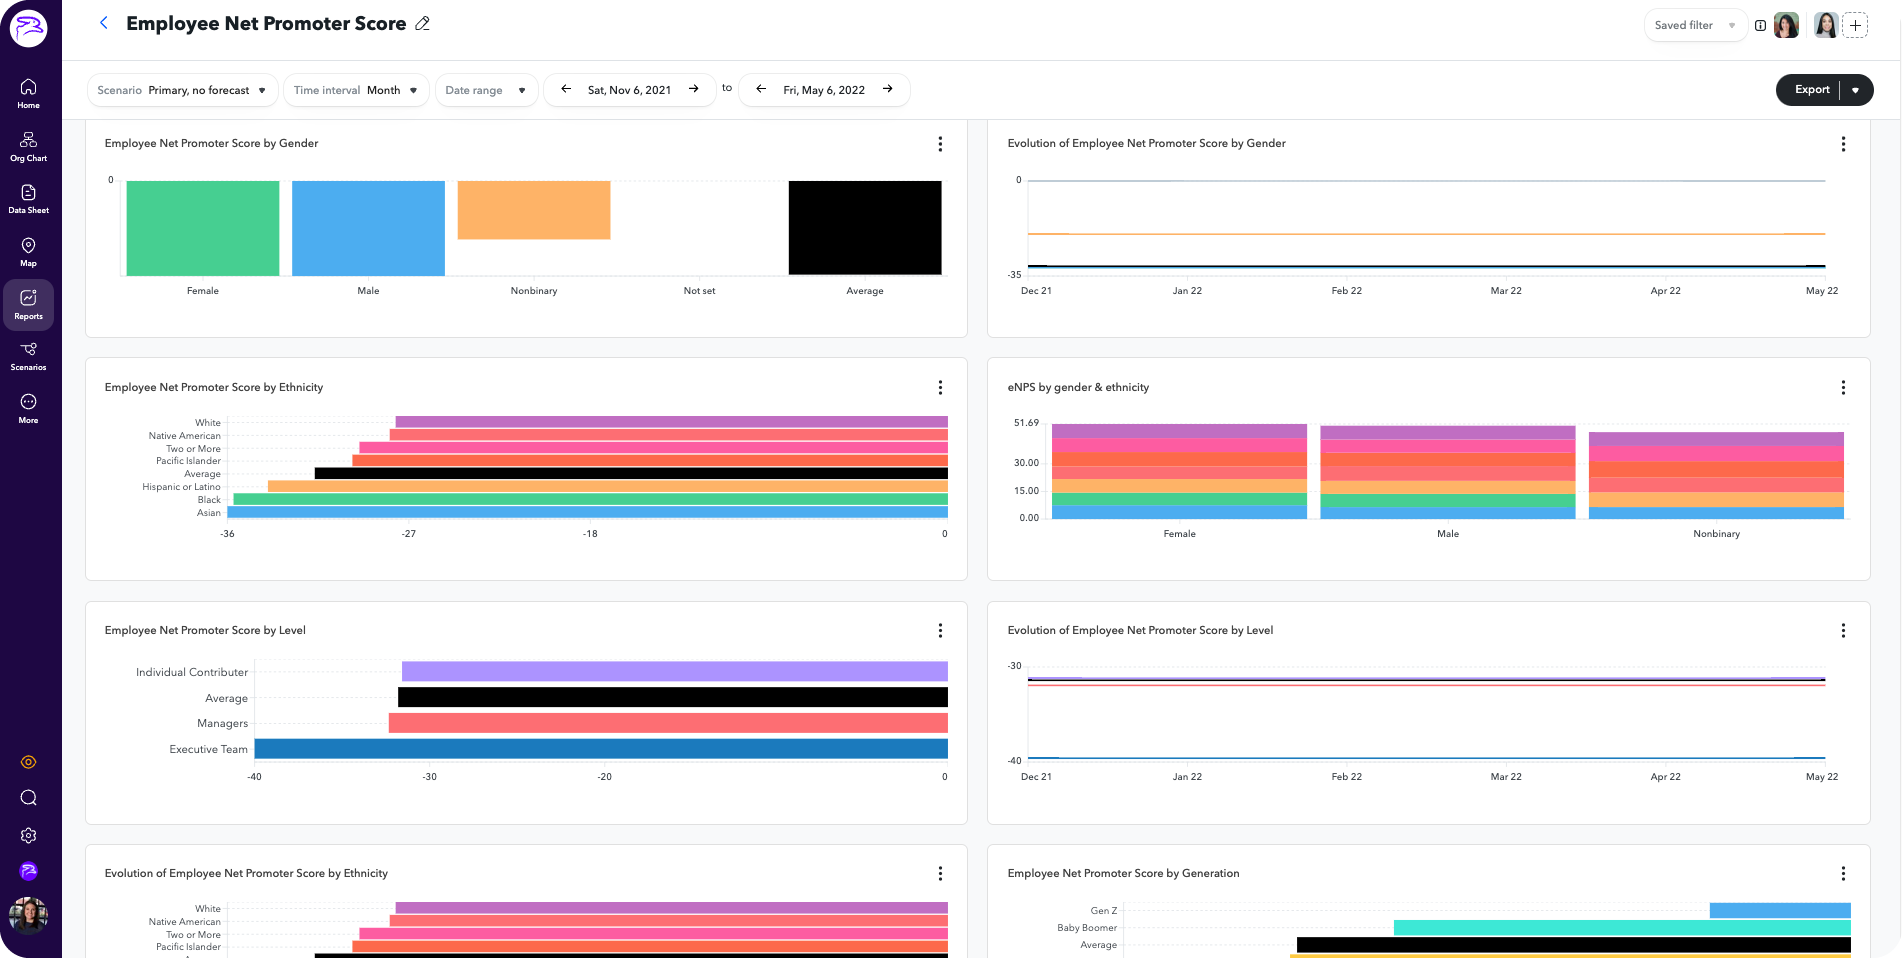
It’s important to not only review your eNPS data, but also identify any trends across demographics so you can act quickly and strategically.
HR leaders know the importance of keeping top talent. Since people are the backbone of your company, you want to ensure you’re doing everything in your power to engage, challenge, and grow your employees.
Guilana Zara, Head of People at Aper, agrees that HR should never lose focus on what matters most: your people. She explains: “This means we need to prioritize strengthening relationships, building trust, working with empathy, and practicing active listening as the basis for everything we do. The most successful teams will share the same spirit and values, keep the culture alive, and be motivated to work together.”
To ensure you’re creating a positive employee experience, calculate your employee retention rate and turnover rate, which are both key indicators of company culture, engagement, and growth.
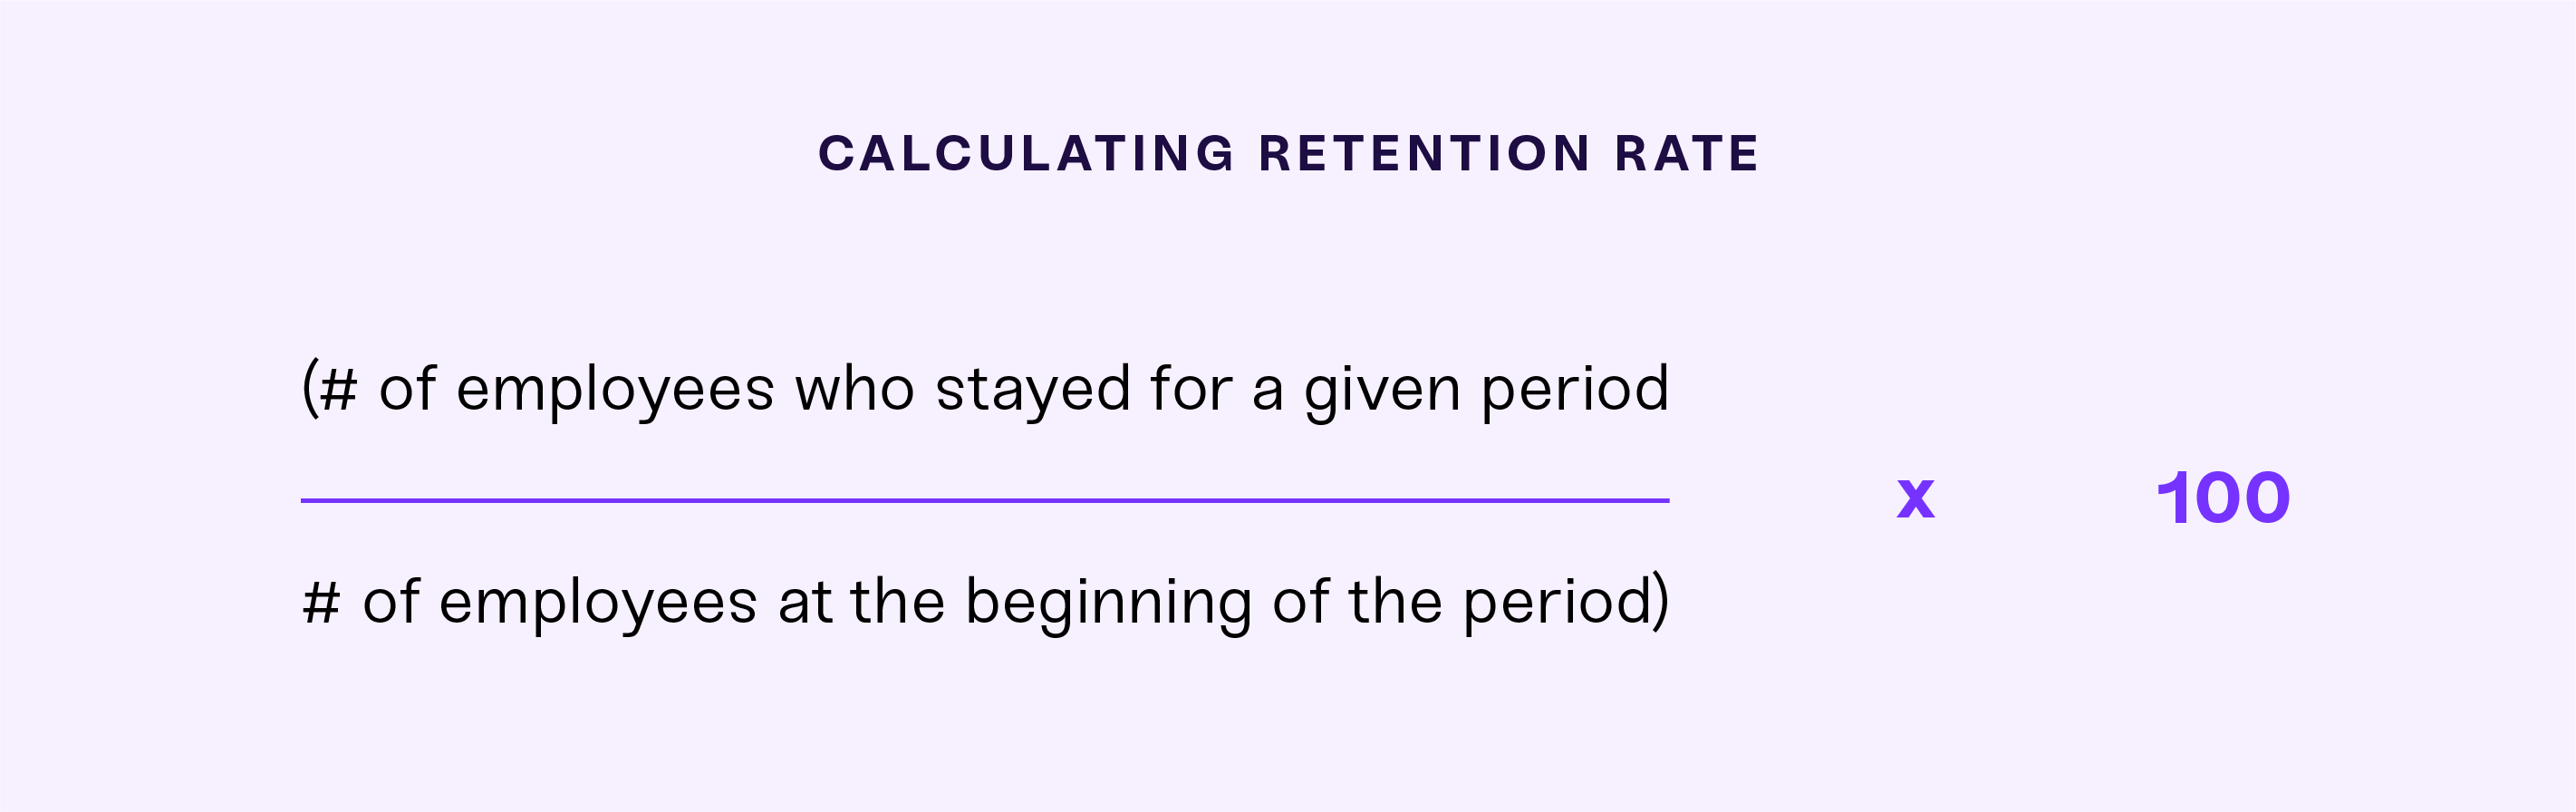

Retention rates allow you to see the stability of your workforce within a certain time frame. When you have a high retention rate, your organization experiences increased revenue, an improved culture, and a better employee experience. Note that retention rates greatly differ between positions and levels within your company, so you won’t have a “one size fits all” model.
Alternatively, turnover is costly and can seriously hinder businesses reaching their objectives. That’s because you’ll have to find, hire, and train new employees, which eats into budget, resources, and productivity. If you have a high turnover rate, your employee experience is likely lacking in one of the above steps of the employee lifecycle.
It’s also important to look at trends and intersectionalities within these rates:
Again, employee feedback is helpful to provide additional explanations to your findings and help you determine next steps as a team.
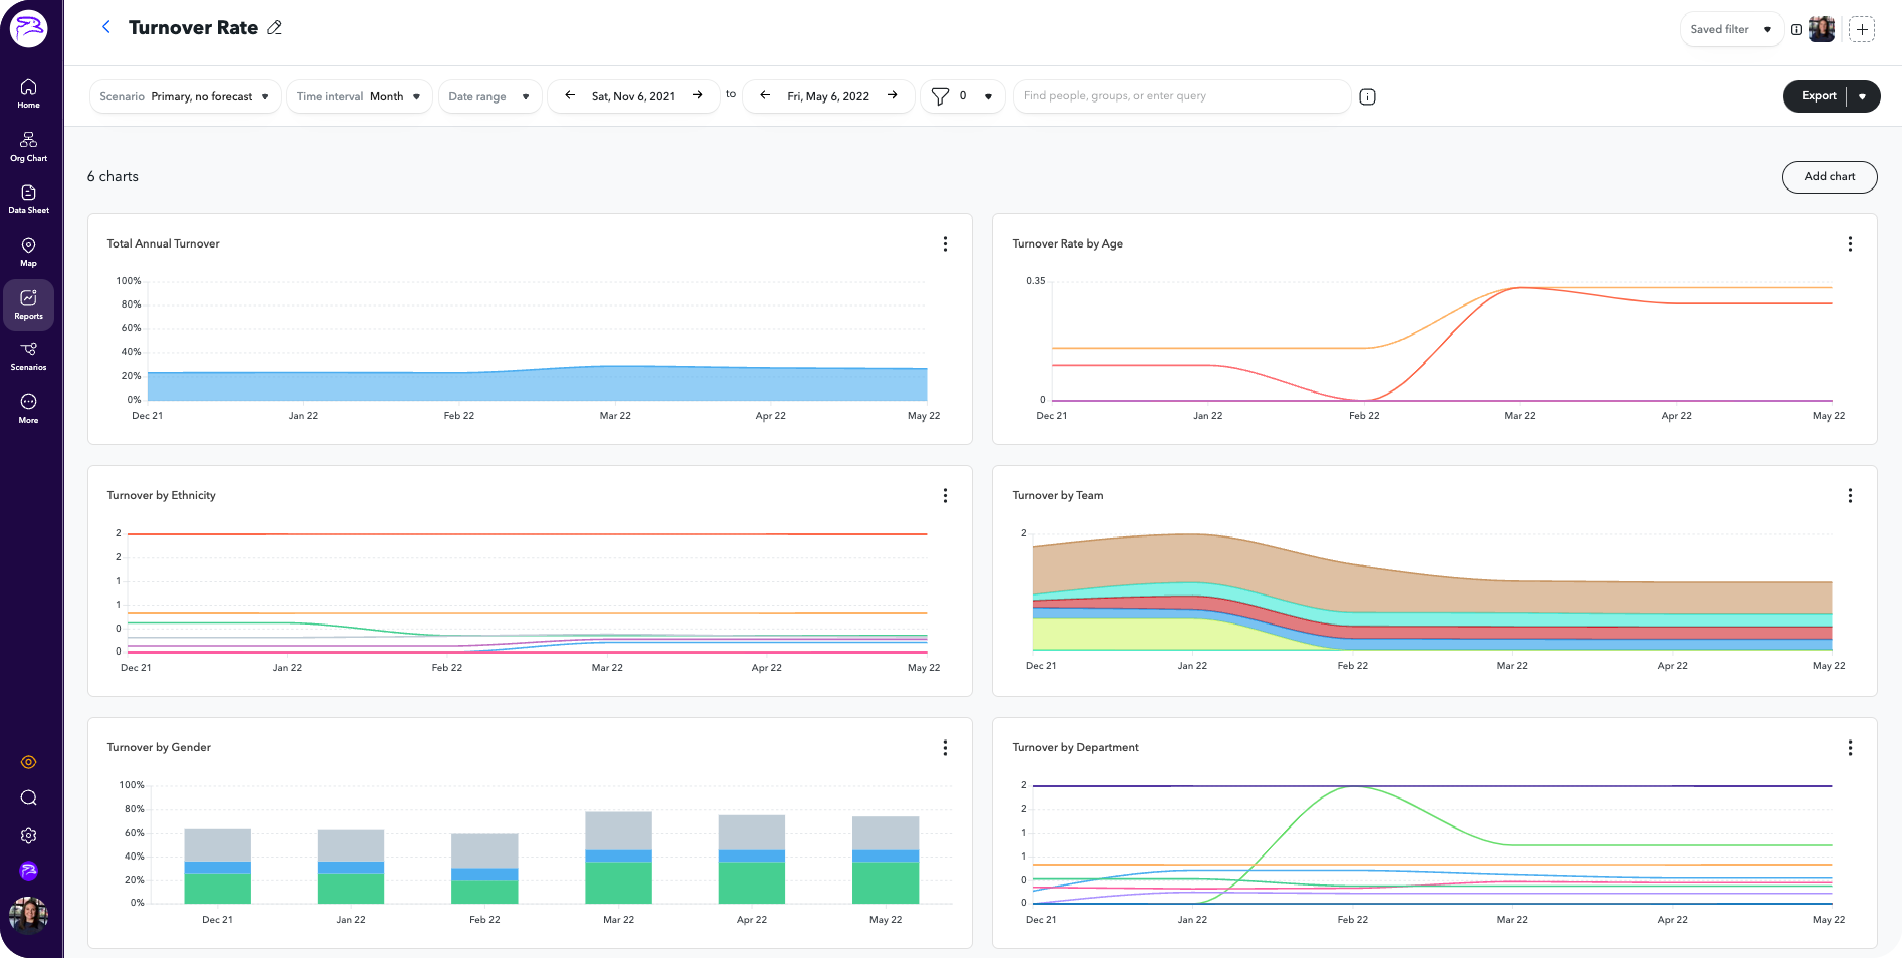
Get to the bottom of your turnover rates by logging and reviewing your people data.
Separation in any organization is healthy and natural. But just like TV shows that can’t hang onto cast members, frequent departures from your company should be a concern.
In this stage, the best kind of data you can collect is qualitative. People leave for a variety of reasons, such as new opportunities, poor fit, and retirement. For the former, it’s your job to figure out why they started looking for and accepted a new role in the first place.
According to Barry Marshall, CEO and Founding Partner of P5 Collaborative Consulting, any negative triggers have already happened (they’re leaving!) by the time the exit interview is scheduled. Now is the time to glean any insights – positive or negative – into their employee experience to determine next steps for you and your company.
Similar to the HR metrics mentioned above, this conversation is great for a birds-eye view of your entire organization. Moreover, it’s extremely valuable when you gather detailed feedback and apply your new knowledge to certain teams, departments, or roles. This information can help you solidify your employee experience altogether by helping target any areas of concern, such as ineffective management styles, unrealistic KPIs, and biases that show up on performance reviews.
HR metrics are key to understanding the ins-and-out of your employee lifecycle. From developing recruitment strategies to optimizing professional development plans, you’ll be more strategic and informed at every phase. Importantly, when you centralize these HR metrics and make them accessible to the right people, you empower your leaders to enhance your employee lifecycle now and in the future.


Sign up for a free demo today.