Having access to the right data when you need it can be a total game changer.
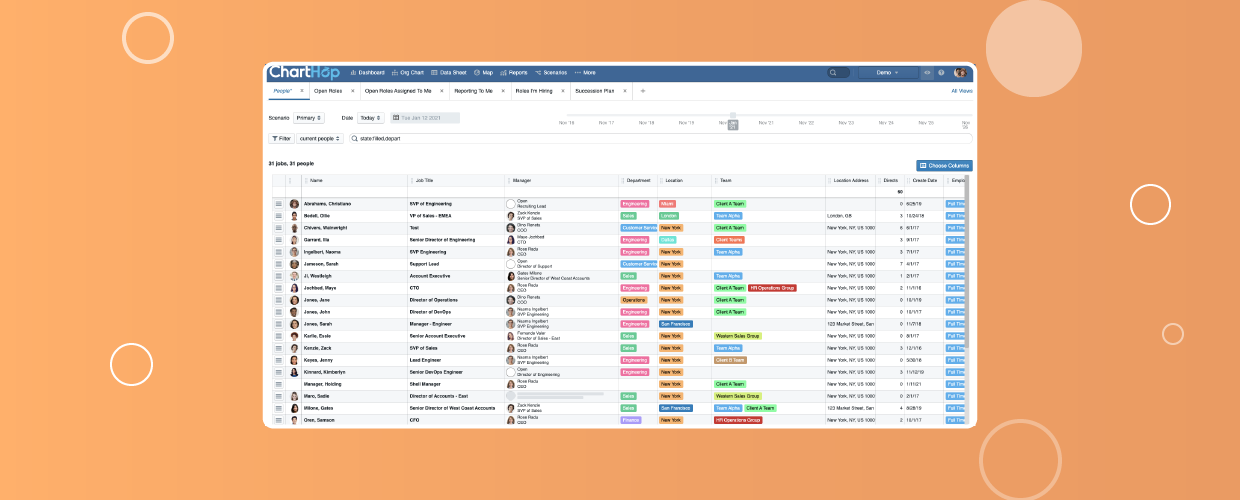
When you need to view a lot of your team’s data at once, ChartHop’s Data Sheet is your best friend. With its high data-density, ease of customization and intuitive layout, ChartHop’s Data Sheet makes storing, viewing and managing your team’s data easy.
And now, with ChartHop’s newest Data Sheet Views feature, you have an even simpler way to access, sort, and manage the information in your Data Sheet – without manual spreadsheets.
This new update comes with:
- View Tabs – Each tab represents a different View of your data – with an independent set of columns, filters & date selections. Switching from task to task has never been easier or more efficient.
- Saved Views – Create a View once and never create it again!
- Share Views – Share Views directly inside the app. No more emailing/Slacking URLs (unless you want to).
- Duplicate Views – Don’t start from scratch — just copy an existing one and modify it to suit your needs.


Creating a View is simple
Next time you need to pull a spreadsheet of employee data or pull a report, create a View!
Follow along with this step-by-step to create a saved View for “My Team” that you can create and share with managers and team leads.
- Add your Filter (e.g.
under:mewill auto filter the sheet to only show the employees under the manager or person who is viewing the sheet)
- Add your Columns – the fields / data you want in your View (e.g. Click select columns and pull in all compensation fields)
- Save it
- Share it

And voila, your Views will automatically show each manager and team lead the information for their respective team.
Your Views will always be up to date – whether you open them today or a year from now – when you choose “current day” as your date. If you want to save a View of your data at a particular point in time (i.e. the day before an acquisition), simply set your date to that “exact date”.

Save Views for easily accessible data
Views is a great tool for answering those everyday and once-in-a-while questions buzzing around the org:
“How big is the Engineering team and who are its current members?”
“How many new hires on Sales are starting next month?”
“How can I see my team’s eNPS survey responses?”
Views prevent the need for ad hoc and duplicative data pulls over time. If the spreadsheet or report you’re trying to pull is something you or your teammates may need again, save yourself time by saving it as a View.

We created this feature to help people managers and operational leaders save their most frequently used reports like:
- Employees in 1st year
- Employees in first 30 days
- Employees starting next 30 days
- My Team – Gender and Ethnicity
- All Compensation Roster
- Equity Roster
- Recruiter View for Open Jobs
Now you have the information right at your fingertips next time someone comes knocking at your (virtual) door.

Align your colleagues with Views sharing
Views empowers your colleagues with the context they need to get their job done.
For example, you can create department specific Views on open positions, new hires, or performance data. Once your Views are completed and saved, you can securely share them with your colleagues.

With Views sharing, you no longer need to worry about sending sensitive information to the wrong people. For example, if a department head shares a View with compensation data on it, only the people who already have access to compensation data will see that information. You can also set permissions to “Limited View” which only allows the person to view the View, not save changes or delete the View.
Break up with your spreadsheets
Building out and storing your org’s data in spreadsheets is a time consuming and error-prone process, especially when you have to do it again and again.
Views takes away the pain with save-able sets of columns, filters, & dates. Build it once, save it, and share it with your colleagues – all in ChartHop.
We’re excited to save you hours of time and make data even more accessible. Reach out to [email protected] if you have any questions!