We’re on a mission to make people analytics more accessible and actionable for everyone in the organization.
This means helping leaders plan for more intentional growth and helping every employee unlock insights about the organization and how work gets done.
To improve this experience and give teams a better way to visualize, analyze, and understand their people, we decided to roll out a new UI with a cleaner and more colorful aesthetic earlier this year. Starting in March, we redesigned the org chart and navigation bar before moving on to maps.
Now, we’re excited to announce that our refreshed UI is officially complete with updates to profiles, data sheets, and scenarios. Here’s what you need to know.
Connection-Driven Profiles
Getting to know your teammates — their job descriptions, the objectives and key results (OKRs) for which they’re responsible, their direct reports, their preferred pronouns, and more — is always important, whether your workforce is remote or in person. As your company grows, putting this type of profile information at everyone’s fingertips can improve the employee experience by promoting connection and helping everyone easily navigate the organization.

To that end, we updated the profiles page to include information at-a-glance in a more visually appealing way. Profiles are highly customizable and can include everything from a recording for name pronunciation to a people-focused Q&A in which employees can answer any number of questions about themselves (some of our favorites are “what is your superpower?” and “what’s your preferred communication channel?”).
The new profiles also make acting on all of this information easy by offering streamlined communications through direct links to contact each person on channels like email and Slack.
More Details, Simplified
Data sheets offer a flexible way to bring together highly detailed people analytics, and with customizable fields, the sky is truly the limit on what you can put together. But with more detail comes more complexity.
That’s why we gave data sheets a refresh to make all of these details more approachable. Our new design is cleaner and simpler so that users can more easily understand and adjust the data in front of them.

For example, it’s now easier than ever to filter data in a sheet with our point-and-click options. Meanwhile, color-coded designations for different categories of data make it easy to quickly identify differences in a way that’s simply not possible with a traditional spreadsheet. You can even save different views with specific columns selected that you can share with others and reference over time.
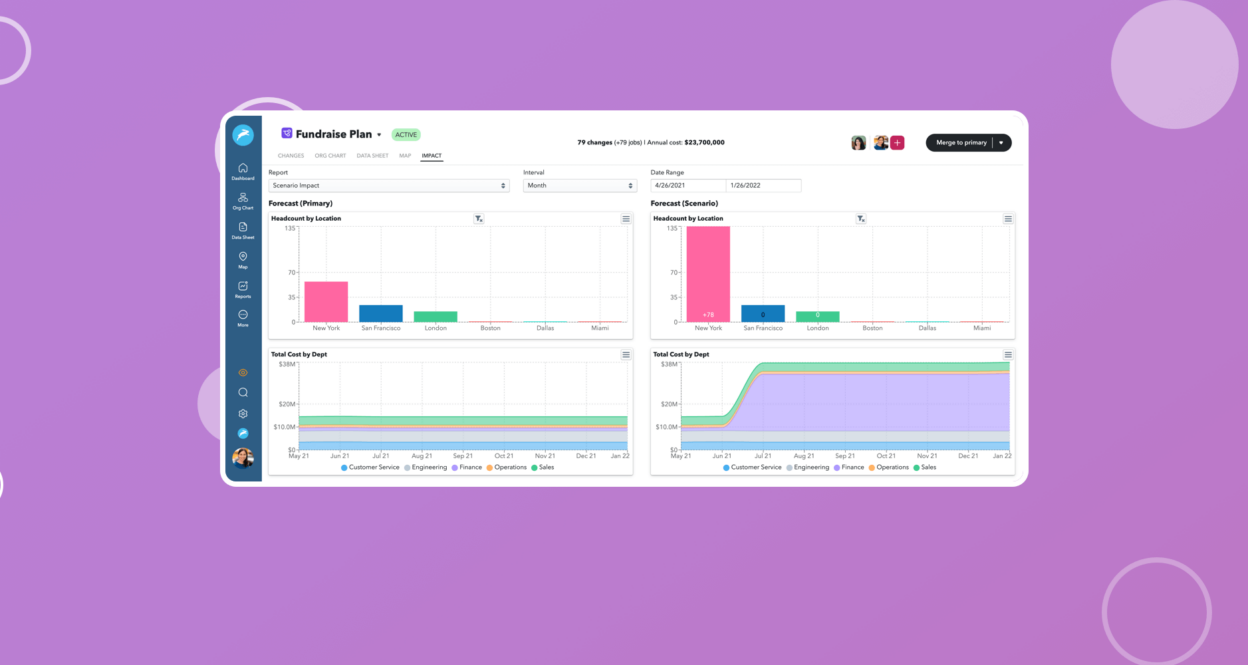
Secure Collaboration on Scenarios
Headcount planning can quickly become a headache with all of the moving pieces like new roles, promotions, and compensation updates, all of which contain highly sensitive information. ChartHop’s updated scenarios feature makes it easier than ever to visualize different options and collaborate on plans without sacrificing privacy and security thanks to granular, role-based access.

The latest changes allow you to easily group together scenarios and compensation planning for a more streamlined process, quickly find the scenarios you’re looking for with an updated list view, and easily combine scenarios when you’re ready to view organization-wide growth plans.
Along the way, the ability to comment directly on a scenario and keep conversations centralized, rather than distributed across channels like email and Slack, can increase efficiency and transparency around how decisions get made.
Putting Customer Experience First
These UI improvements will drive faster and more strategic insights and action (and spark joy in the process) — a critical first step to unlocking your people analytics in pursuit of key goals like driving equitable growth and building a people-driven business grounded in communication and trust.
Thank you to everyone who has offered their valuable feedback. We are so hoppy to be growing our product with you.