ChartHop is designed to enable fast, easy, and flexible org design and re-design.
To design multiple headcount scenarios and measure the impact of those changes, follow these simple steps:
- Set up your Current Organization
- Start planning with Scenarios
- Share your Work
1. Set up your current organization
Your current organization is your Primary Plan – it’s the headcount you currently have and the hiring plan you’ve already approved. To set it up we will:
- Upload your current headcount
- Upload your current hiring plan
- Set up your Org Settings
- Understand your current org
1. Upload your current headcount
There’s two ways to upload your current headcount to ChartHop:
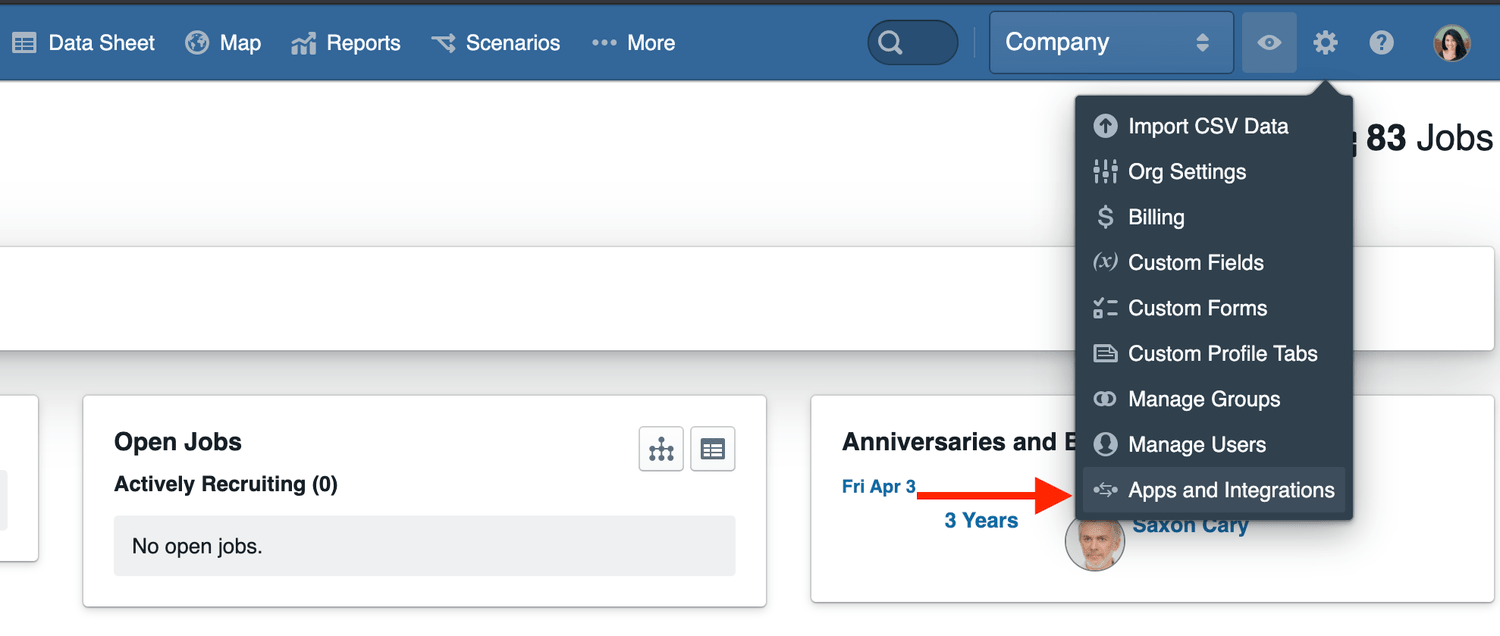
1. HRIS Integration: Check if your HRIS is currently supported by going to Apps & Integrations. If so, select your HRIS and follow the directions. You may need to get the API key from your system’s admin and some HRIS require that you reach out to them for the key. Reach out to us at [email protected] if you’re not sure how to move forward.
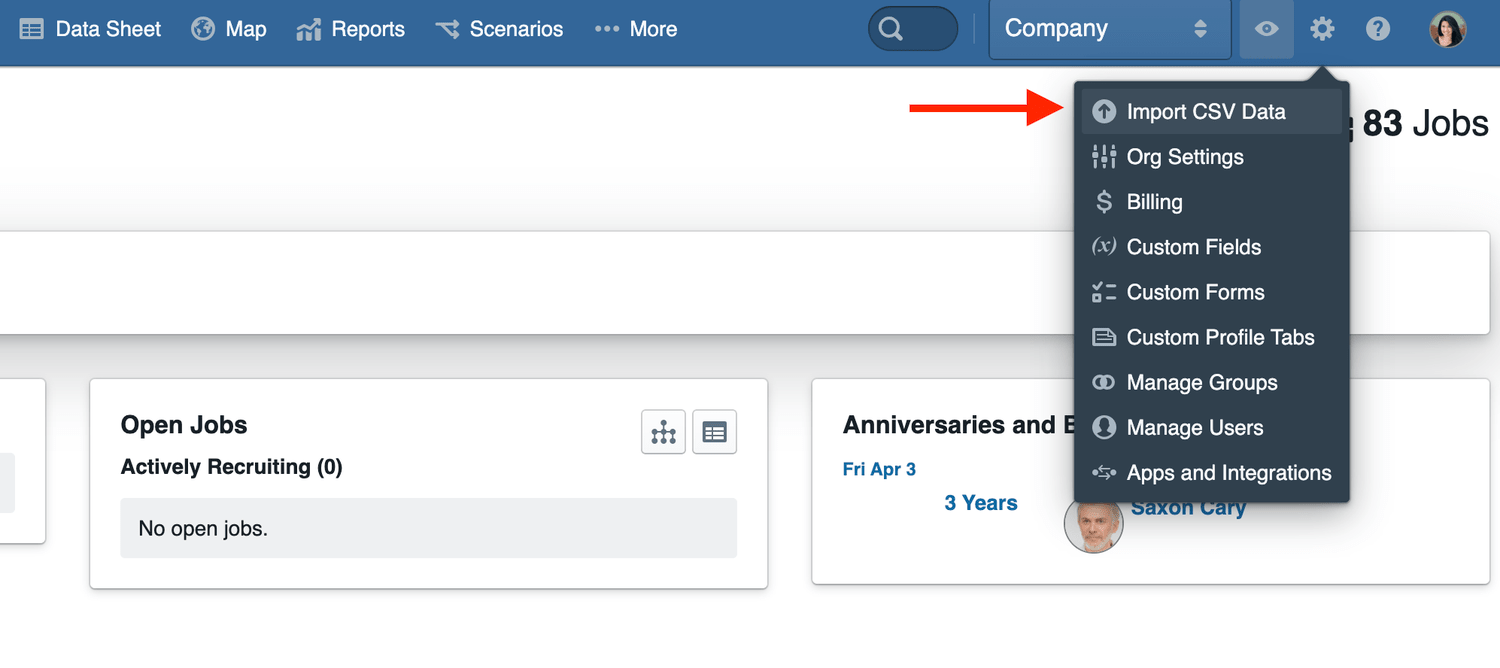
2. Manual upload: Download the template at charthopp.in/template-headcount and add your data using Excel or Google sheets. Check it with the data checklist at charthopp.in/prep-data. Then, upload it via the CSV import. Note that you can always add more employee data later this way, too. Reach out to us at [email protected] if you need additional support.
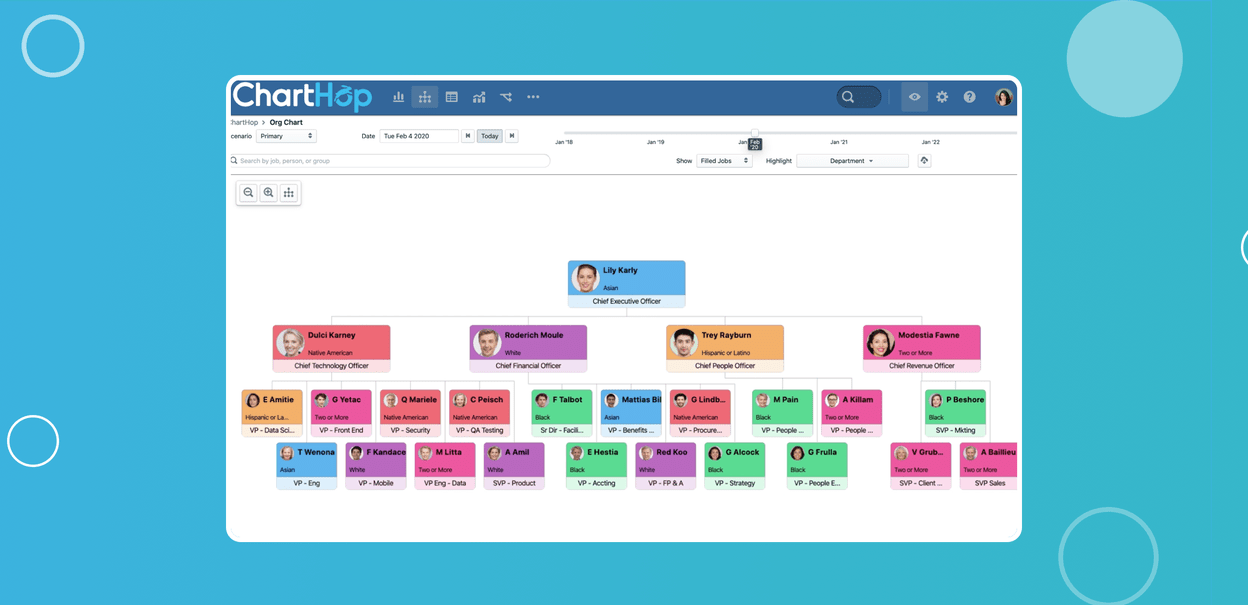
Now, you’ll see your Org Chart come to life! Explore the different reporting structures and visualize your org chart through every type of data you’ve uploaded – department, location, tenure, gender and more.
2. Upload your current hiring plan
To upload your current hiring to ChartHop, download the template at charthopp.in/template-hiring-plan and add your data. Check it with the data checklist at charthopp.in/prep-data.
Then, upload it via the CSV import.
Note: Open roles will show as either Inactive, meaning you’re not currently hiring for the role, or Active. You can change this by either adding it as a column in your data upload (Status) or by editing individual open roles within ChartHop. This does not affect any budget impact calculations.
Once all your data is in, you’ll see your Org Chart update to include open roles! Use the Time bar to Hop back in time and into the future.
3. Set up your Org Settings
ChartHop’s platform is customizable to fit your needs. To understand the impact of your changes within Scenarios, set up the following Org Settings:
- Add Currencies – ChartHop supports them all
- Change your Fiscal Year, if applicable
- Set a cost multiplier – a blanket multiplier to apply to all headcount costs including taxes and benefits
4. Understand your current organization
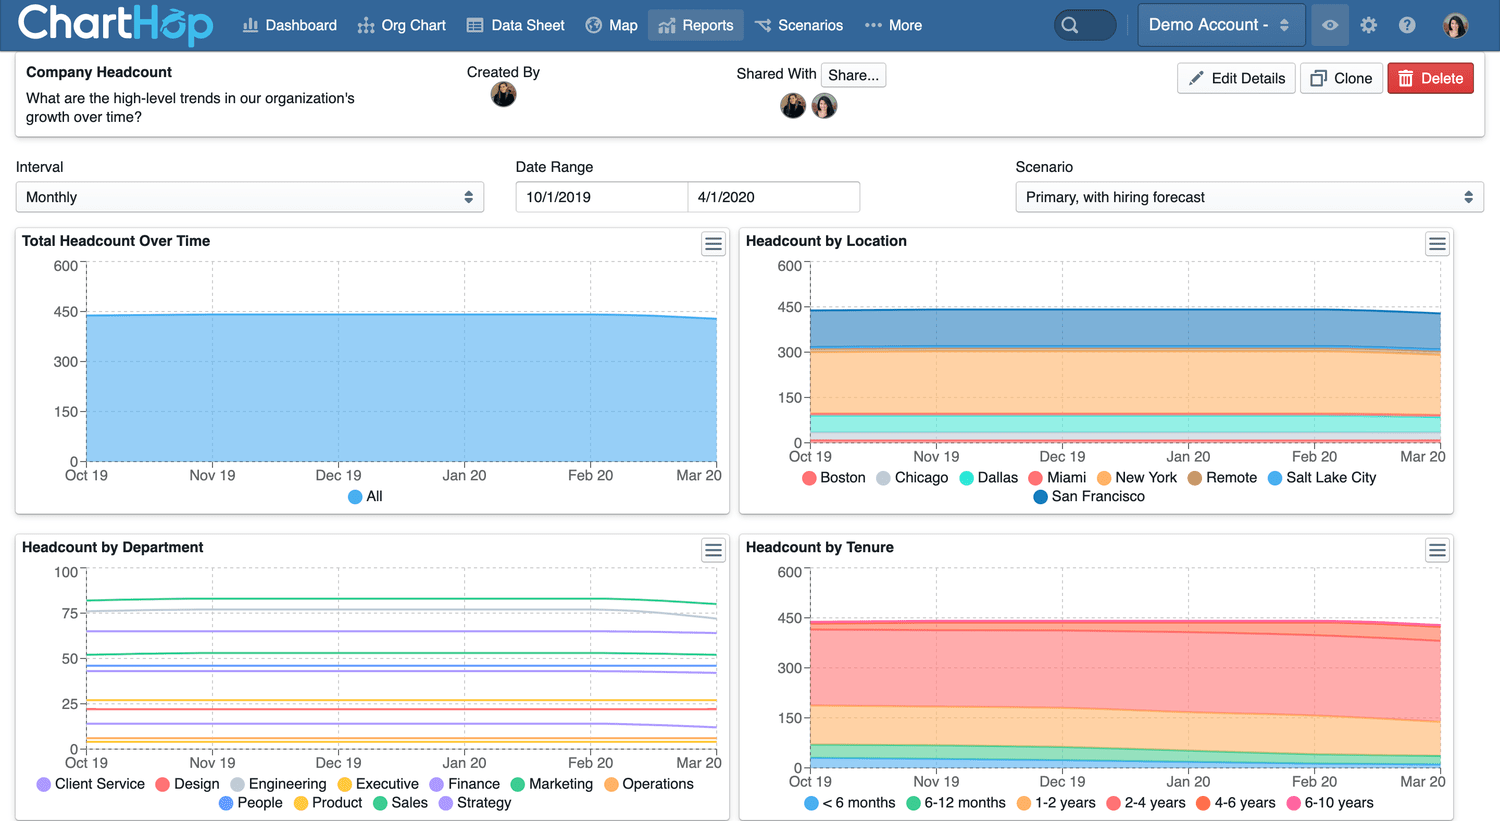
Now that your data is in ChartHop, you can use the robust analytics engine to create reports and visualize trends over time.
These reports are always available to you and update as your data updates. You can view the data for any time period (even into the future!) and can customize them with filters, colors, and more.
The ChartHop team has created some out-of-the-box reports for you to use. To download these, head back to Apps & Integrations and scroll all the way down to Available Bundles.
We recommend you download:
- Headcount impact
- Scenario impact
Then, head to Reports on the top bar and see your data come to life.
2. Start planning with Scenarios
With Scenarios, you can build sandbox views for alternate hiring plans, projected M&A outcomes, department-specific views, org-wide compensation planning, and more.
To get started:
- Create a Scenario
- Understand the impact of Scenarios
- Invite Collaborators
1. Create a Scenario
ChartHop Scenarios provide the context needed to create data-informed plans in an easy to use, drag and drop interface.
Whether the goal is to restructure a function, merge teams, acquire a new business, shift operating models, add incremental headcount or implement a succession plan to replace a departing leader, scenarios can be used to workshop ideas and put them into action.
There’s different types of planning you can do within scenarios – general planning, compensation planning, promotion planning and more. With everything going on, customers have been doing general planning to figure out how to cut costs down this year. To do that:
- Using the org cart view, visualize the team structure and start proposing changes.
- Take a look at open roles – see them all listed on the right and within the org chart on the left. Delay hiring and close some of them out.
- Propose changes to your existing team – change up reporting structures and compensation, propose promotions and terminations.
Learn more about ChartHop Scenarios here and reach out to us at [email protected] for best practices.
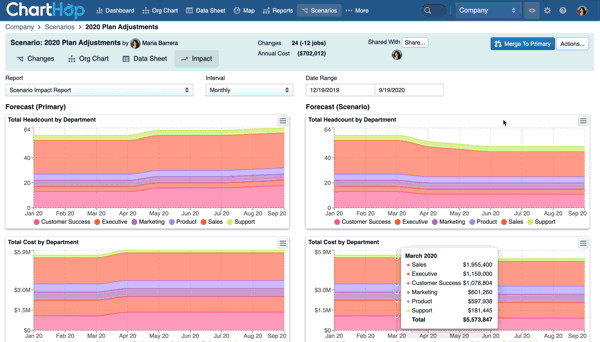
2. Understand the impact of Scenarios
As changes are made within Scenarios, ChartHop tracks every change and shows the impact in the structure, the headcount numbers and the budget.
To understand the impact of Scenarios in detail, you can compare the current state of the organization with the proposed state using custom reports side by side.
3. Invite Collaborators
Invite others to collaborate and discuss proposed changes, easily making further adjustments to compensation, timing or foregoing individual changes all together. By iterating on plans within ChartHop, you can save hours of time going back and forth on emails and creating different versions of the same spreadsheets.
3. Share your work
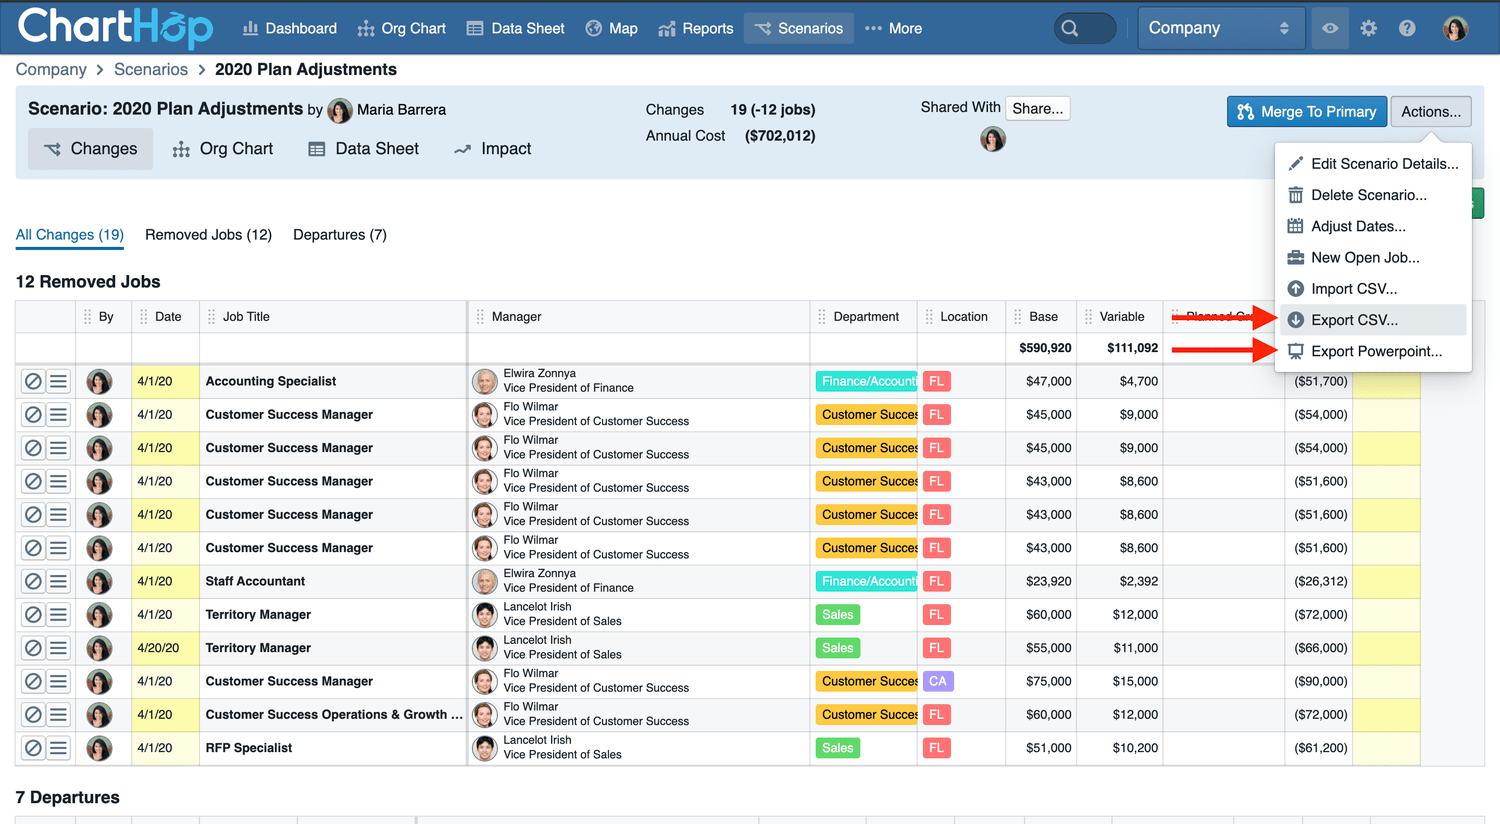
Once you’ve designed plans, it’s easy to deploy them into action within ChartHop or export them and use them in any way. You can export your full org chart (or filter by department, location, and more) directly to slides.
You can also export your Scenarios in a csv or slide format.
Once final, multiple Scenarios are merged with the click of a button, saving HR and Finance hours of time consolidating plans across the company.
If and when consensus on the plan forward is reached, the final Scenario is then pushed to the primary plan by the ultimate approver. This ensures transparency and alignment around approved hires, compensation increases and org structure changes.
We hope access to ChartHop Scenarios can help you easily and thoughtfully react, adapt, and plan during these times. As always, reach out to us at [email protected] if you have any questions.