At ChartHop, we believe data should drive every business decision. Access to visually rich data can tell leaders exactly where they stand. It can also be a tool for charting the course ahead.
Diversity, equity, and inclusion (DEI) matters. Especially given the ongoing dialogue around racial and gender equity.
When it comes to compensation and headcount planning, data can be a powerful tool for companies committed to achieving gender and racial equity in pay.
That’s why ChartHop is releasing its first annual Charting Better Workplaces report, which analyzes real-time salary and equity data from more than 16,000 employees across the technology industry. Our report is the first of its kind to analyze equal pay with attention to both salary and equity. And we are so excited to share what we’ve learned.
The truth is, many HR and people teams do not have all the data they need to understand and address wage inequality at their orgs. ChartHop is changing that by making compensation and representation data across gender, race, level, and department, accessible. We are #hoppy to partner with our customers and friends in this important work.
Together, we can finally close the pay gap.
Below is a summary of our findings. You can download the full report here and access an editable deck to present to your organization here.
Women’s Wages Remain an Issue
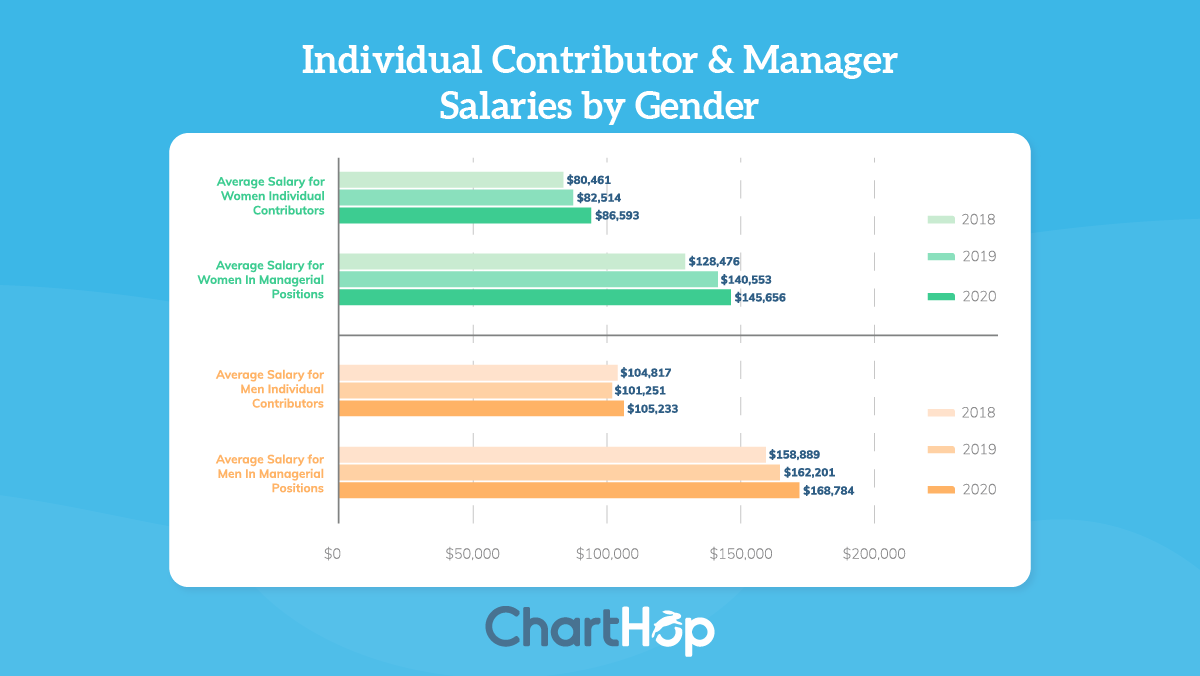
In 2020, men earned 22% more than women, compared to 30% more in 2018. The improvement is promising, but we still have a long way to go.
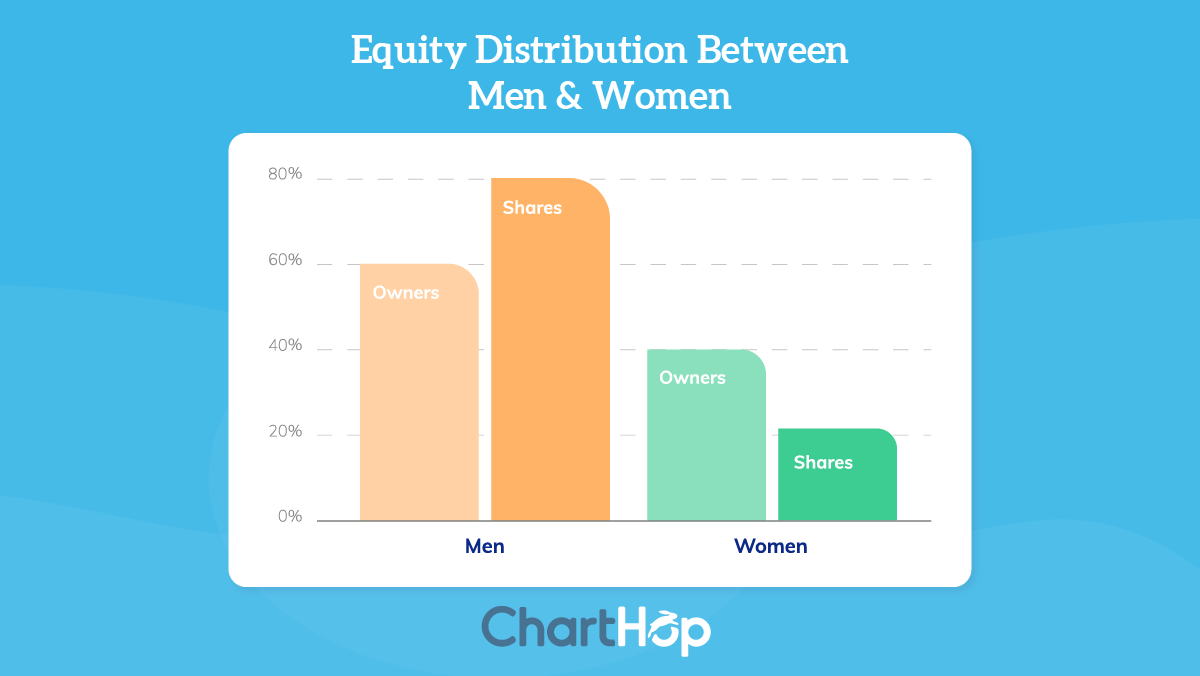
Equity is one of the biggest drivers of wealth in the tech industry, but women own a fraction of the shares men do. On average, men have 63% more ownership in a company than women, and while women make up 40% of owners, they only own 21% of the shares.
Note: We recognize that reporting in a gender-binary framework does not give us the whole picture and contributes to sustained inequality. Unfortunately, many
Human Resource Information Systems (HRIS) do not have an option for Non-binary
designations. We are actively working with partners and customers to address this
issue and change the industry’s standard around Non-binary reporting.
The Role of Seniority
Often, people will cite gender disparities in leadership as a main factor in wage inequality. While seniority and leadership are important, they don’t tell the full story. We found that men who are individual contributors — meaning they don’t manage any other team members — still earn 22% more than women.
When you look specifically at managers, the situation slightly improves. Managers who are men make 16% more than women.
Wages Across Races Lag in Progress
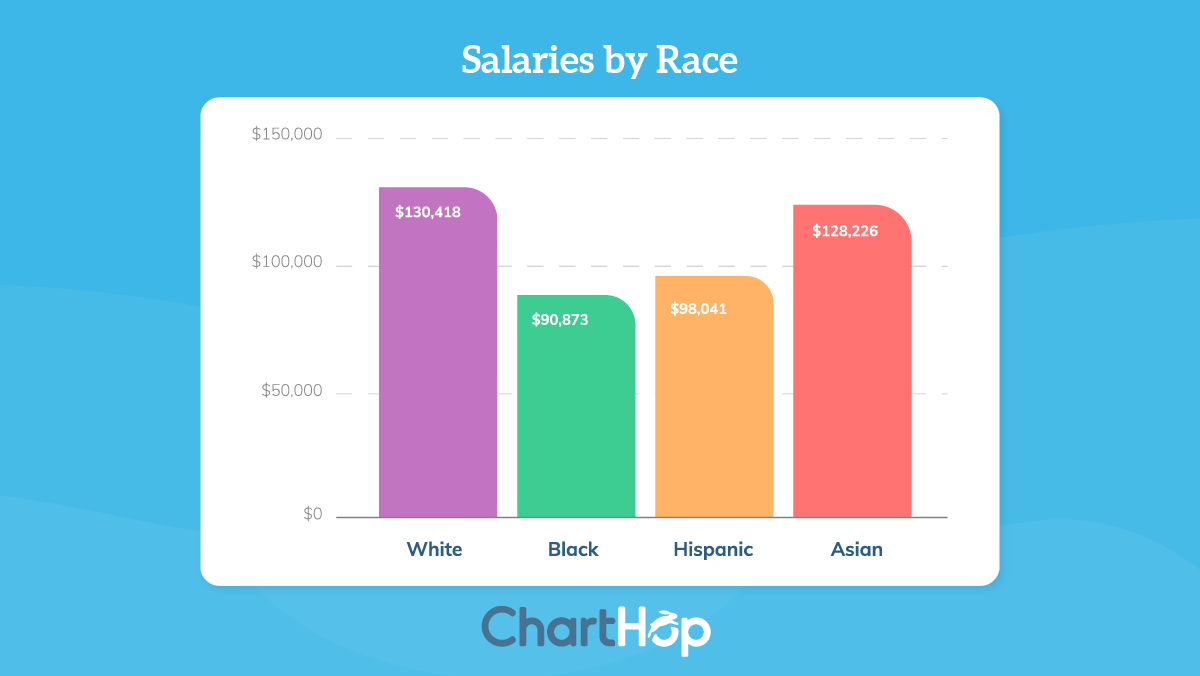
White employees earn 44% more than their Black counterparts, more than double the wage gap between the average man and woman. White employees also earn 33% more than Hispanic employees.
When you look at race as a whole, White employees earn 24% more than their BIPOC (Black, Indigenous and People of Color) counterparts. This is up 6 percentage points since 2019.
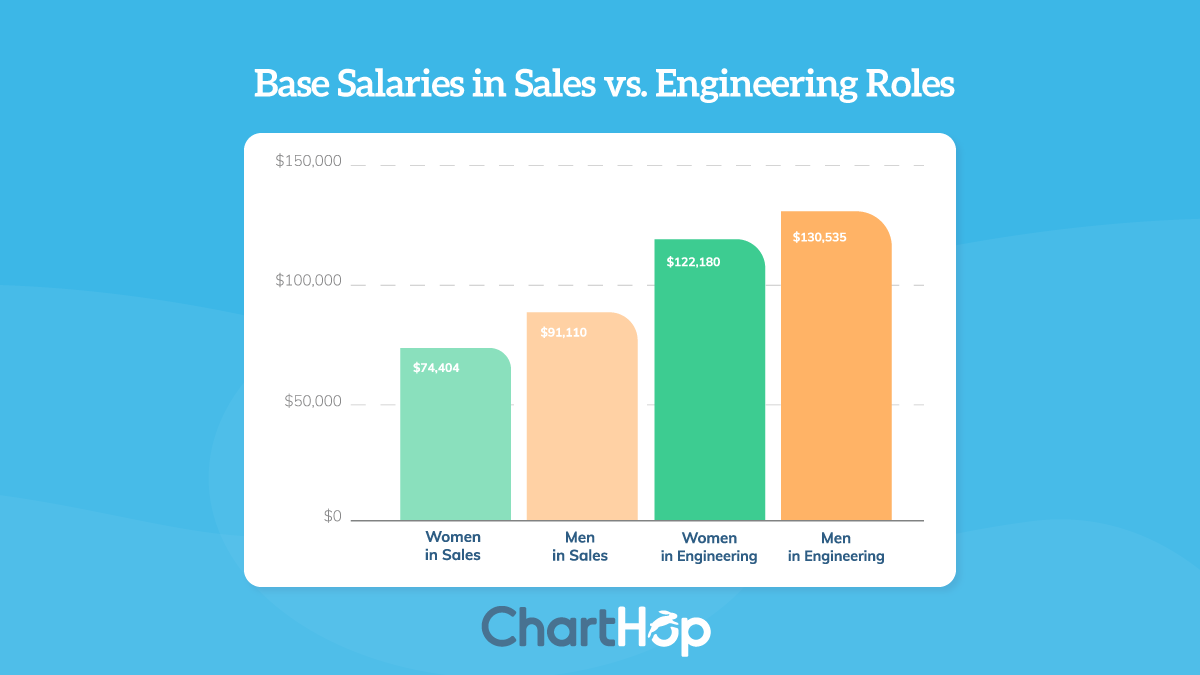
Wage Gaps by Department: Engineering Shows Progress While Sales Fall Behind
Engineering teams serve as a good example for other departments. The average man in engineering earns 7% more than the average woman, which is by far the smallest gap in our analysis.
Sales teams on the other hand, have a lot of work to do. The average salesman base compensation is 22% more than the average saleswomen.
Data Drives Action
Overall, the findings demonstrate the importance of comprehensive data-driven approaches to compensation analysis. Despite the many areas of progress the tech industry has experienced over the last few years, it’s clear that there is still a long way to go.
Armed with the right data, leaders are better equipped to create compensation policies that center equity, hold teams accountable, and dedicate resources to DEI programs.
Wage inequality is a solvable problem, and together, we can fix it.


