
ChartHop is an organizational intelligence company. Our platform connects workforce, business, and financial data in one place, so HR, Finance, and leadership can plan, operate, and make decisions from a single source of truth. Every six weeks the team ships a new batch of features. This release lets the Data Sheet look backward in time, automates time off awards based on tenure or any other field you track, and makes goals readable in every language your team speaks.
Here's everything that's new.
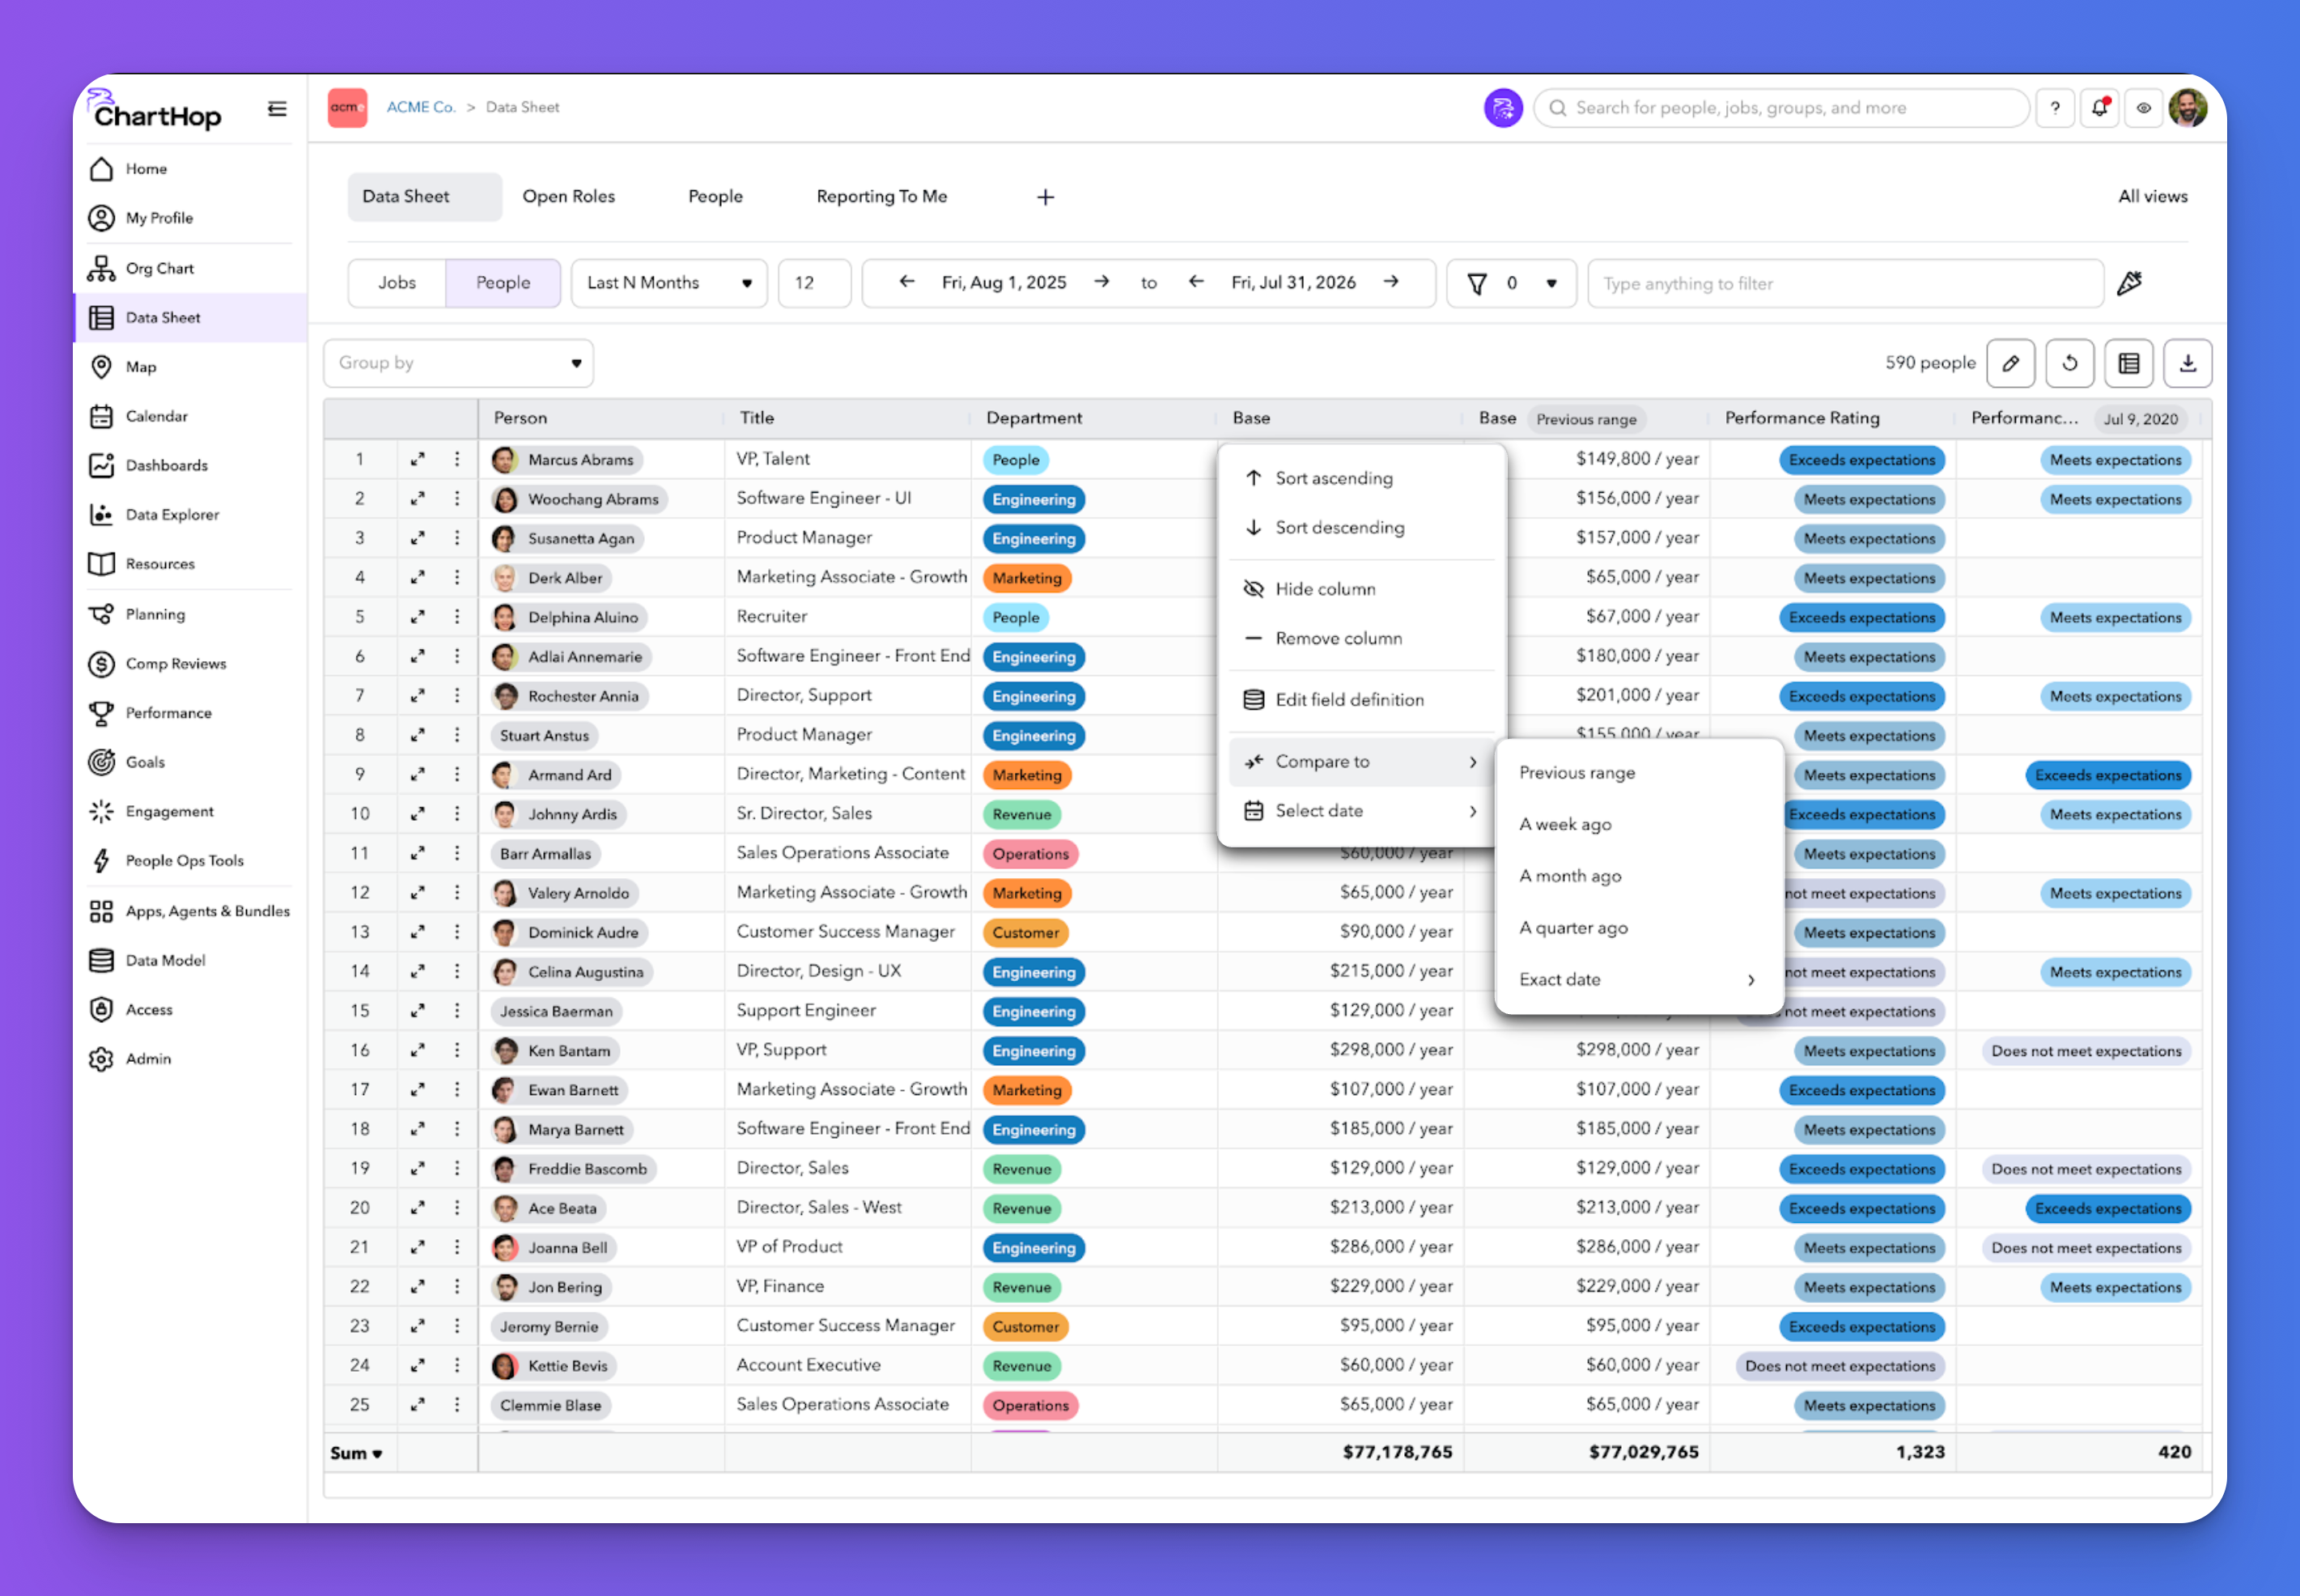
The Data Sheet can now look backward. Add a column that compares any field against a historical date or a custom timeframe, and see what changed without building a separate report.
That cuts down on custom date fields, which means less configuration to maintain and fewer near-identical fields to explain. You can also add the same field multiple times in a single Data Sheet, each with its own date context, so one view can hold today's headcount, headcount at the start of the fiscal year, and headcount twelve months ago side by side.
Available in ChartHop Labs now, moving to general availability soon.
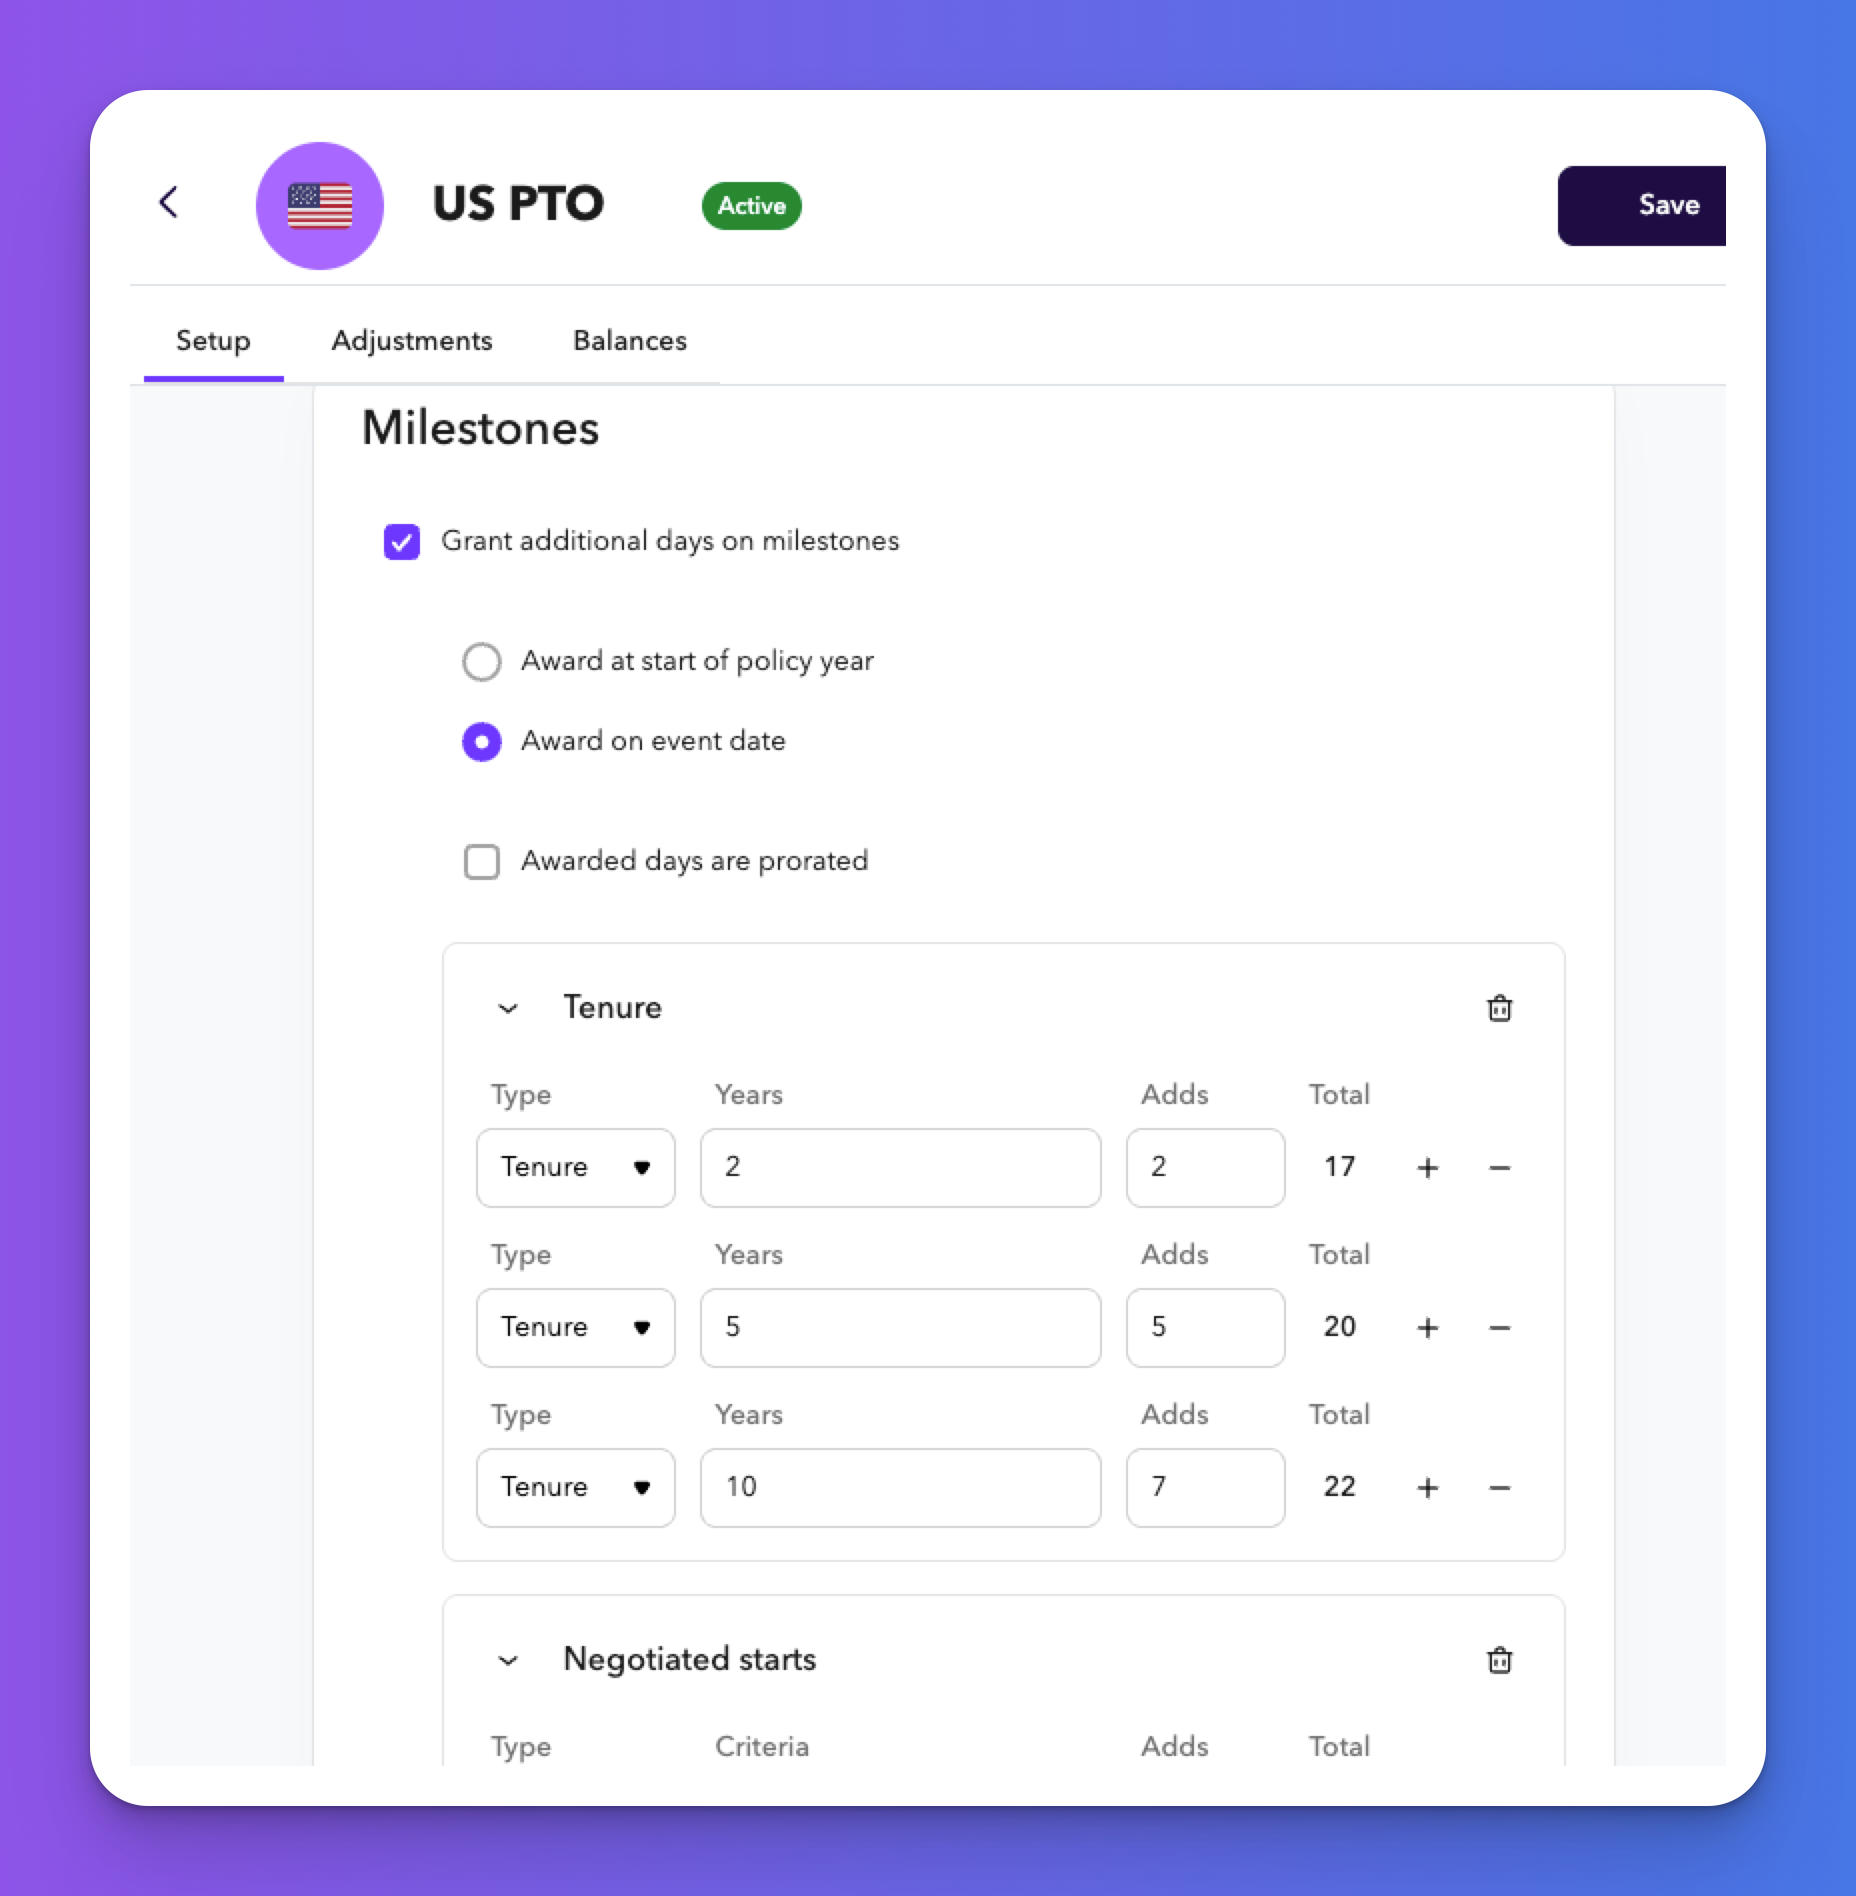
Tenure-based time off usually lives in a policy document and gets applied by hand. Milestone awards move that logic into ChartHop. Configure the tiers once, say two extra days at two years and five at five, and the accruals happen on their own. No manual tracking, no ticket queue.
Available now for all ChartHop HRIS customers. Milestones apply retroactively by default; if you are consolidating older policies and want awards to start from a specific date, your CSM can set that up with support. Read the documentation for the full setup.
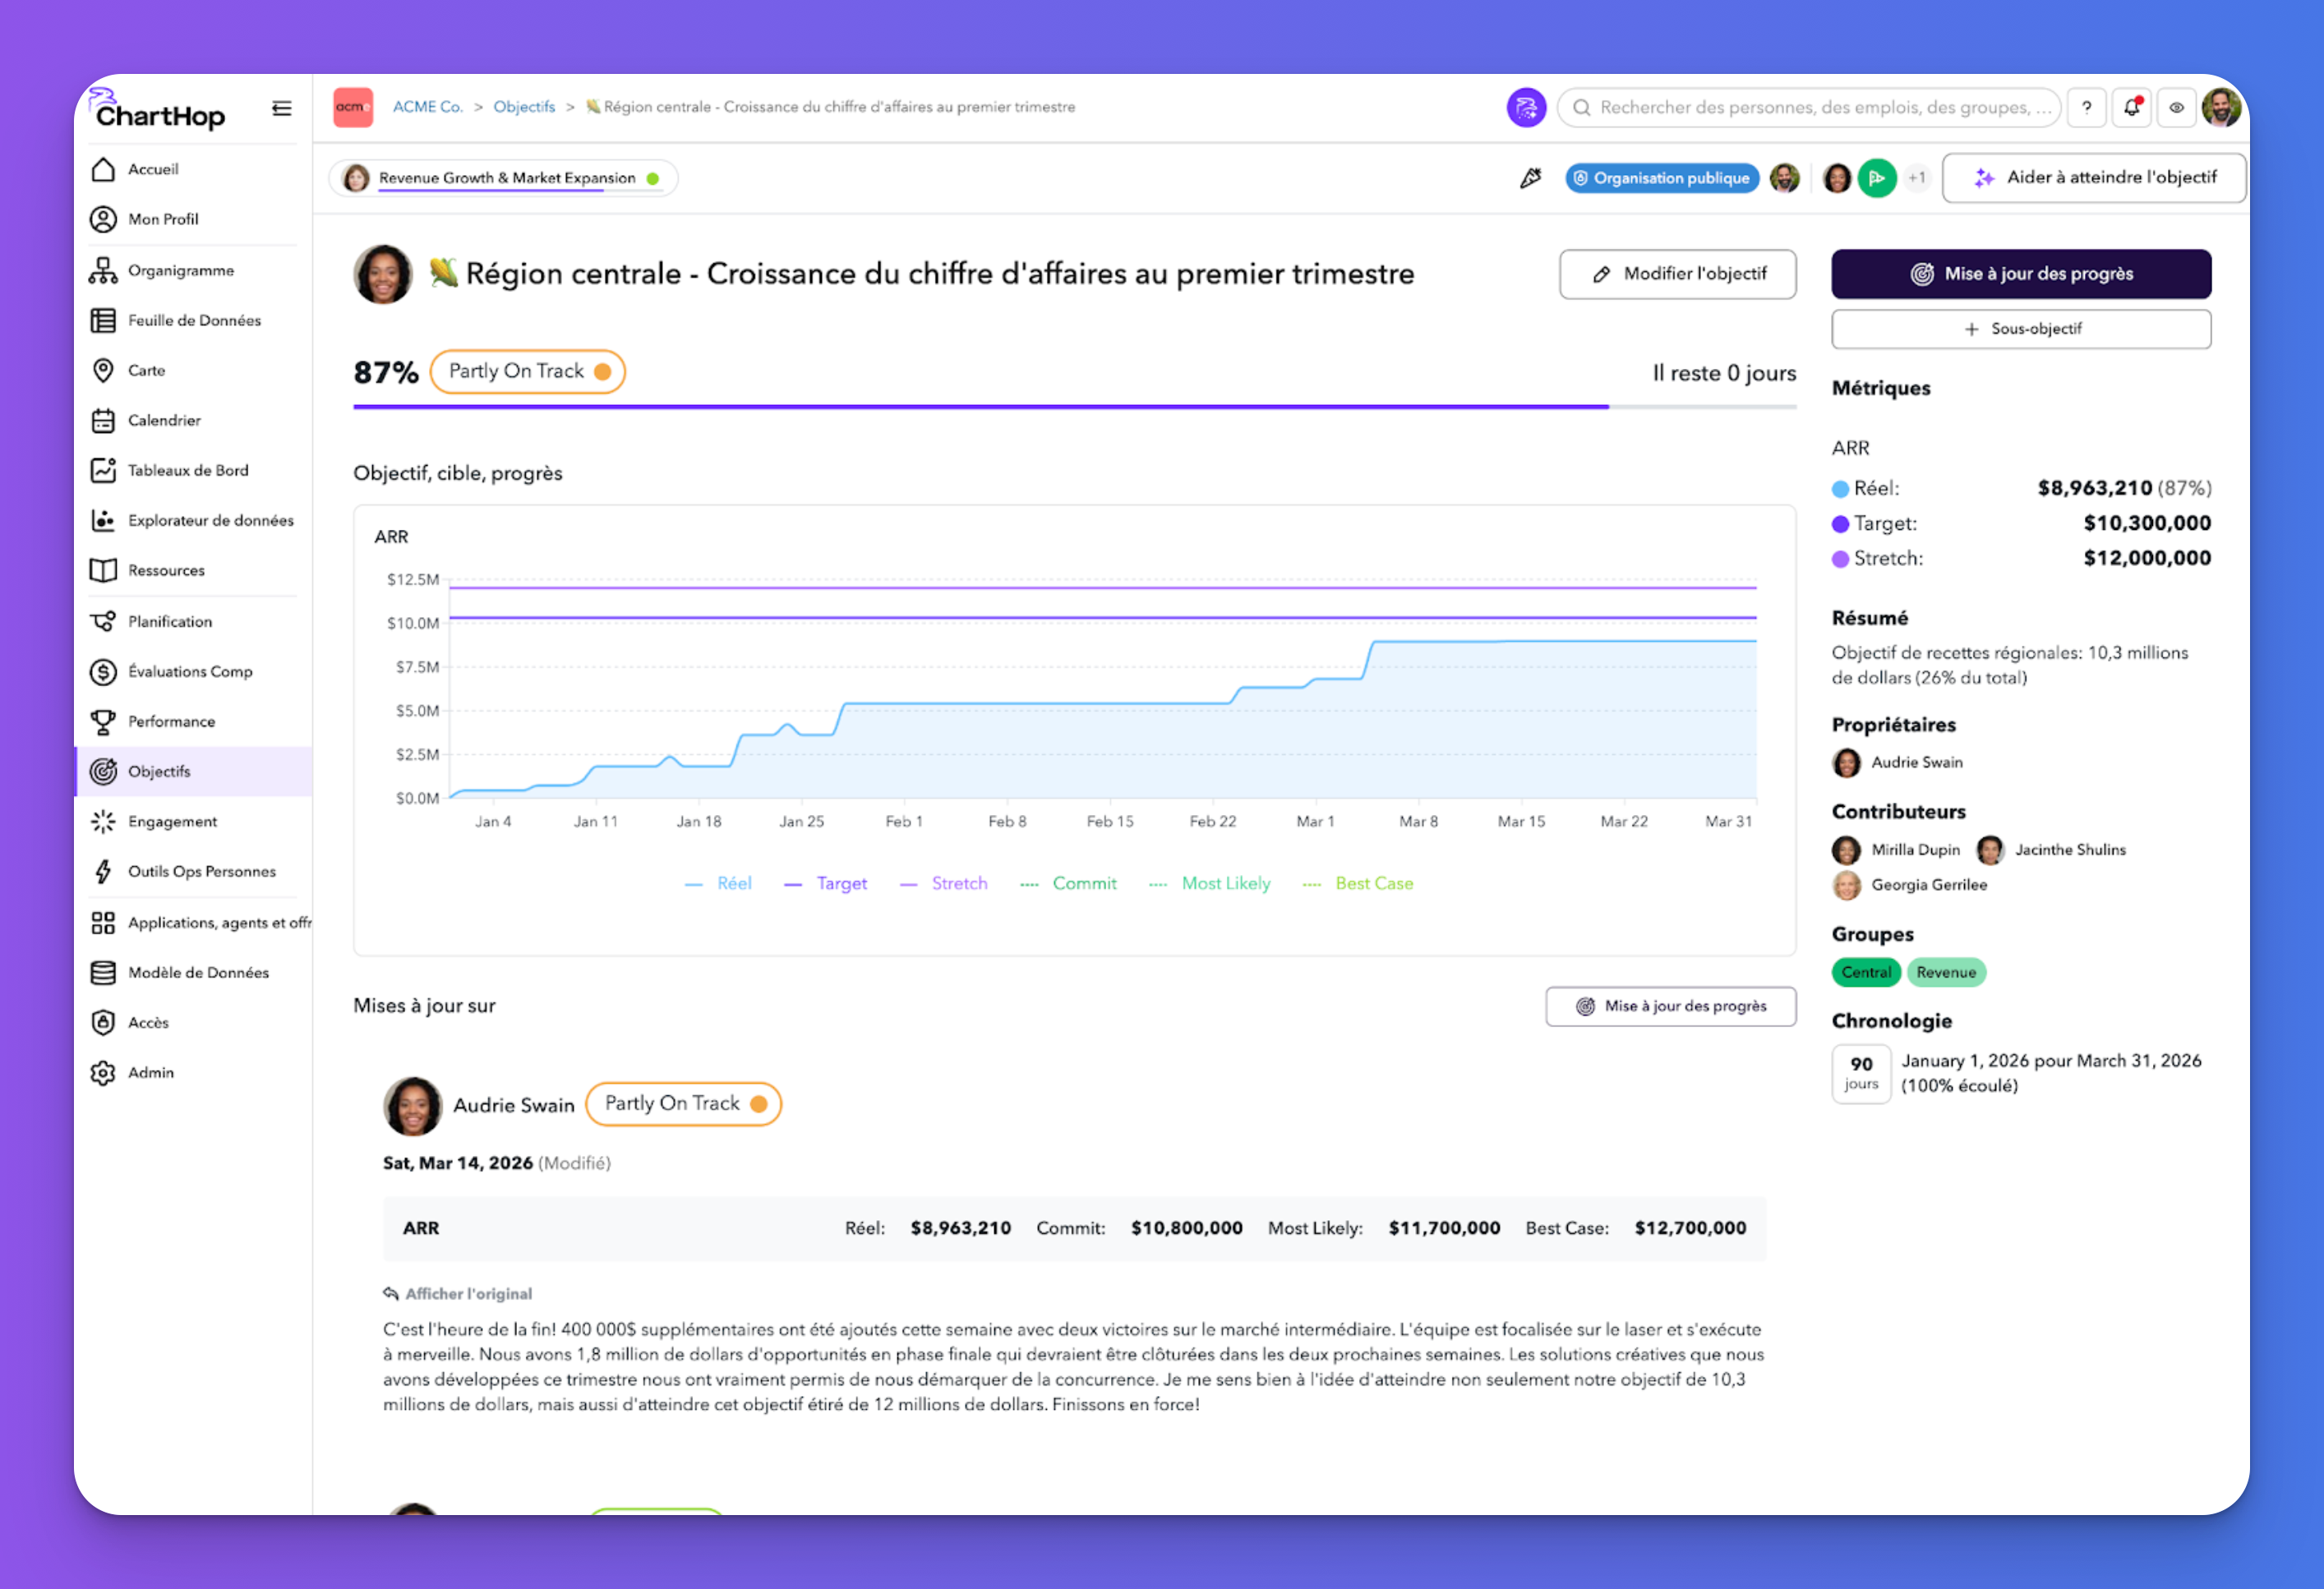
Goal names, descriptions, targets, and milestones are now translated automatically when you save them, and each employee sees them in their preferred language.
A set of smaller updates that came straight from customer requests:
Five more features are in Labs and rolling out soon.
ChartHop admins can turn these on from Admin, then Labs, in the left sidebar. If you cannot find the setting, your CSM or the support team can help.
ChartHop helps HR, Finance, and leadership plan, operate, and make decisions from one connected platform. Request a demo to see these features on your own org data.
Common questions about ChartHop's latest features
Yes. Time-based columns in the Data Sheet let you compare any field against a historical date or a custom timeframe, and you can add the same field multiple times in one sheet, each with its own date context. That means a single view can show today's numbers next to the same numbers from the start of the fiscal year. It is available in ChartHop Labs now and moving to general availability soon.
Yes. Milestone awards let you configure tiers once, such as two extra days at two years and five at five, and ChartHop applies the accruals automatically. Awards can land on an employee's exact anniversary or at the start of the policy year, with full or prorated options, and custom milestones use CQL so an award can key off any field you track. Available now for all ChartHop HRIS customers.
Yes. Goal names, descriptions, targets, and milestones are translated automatically when they are saved, and each employee sees them in their preferred language. Authors can review and correct machine translations in a dedicated Translations tab, and progress update comments can be translated on demand so a distributed team can hold one conversation.
ChartHop admins can enable early features from Admin, then Labs, in the left sidebar. Features in Labs are in active development and move to general availability once they are ready. If you cannot find the setting, your CSM or the ChartHop support team can help.
ChartHop is an organizational intelligence company. Our platform unifies headcount planning, HRIS, compensation, performance, engagement, and goals, and connects them to the business and financial data that drives organizational decisions. Because everything lives in one system, HR and Finance work from the same source of truth and leaders get real-time answers about their organization.

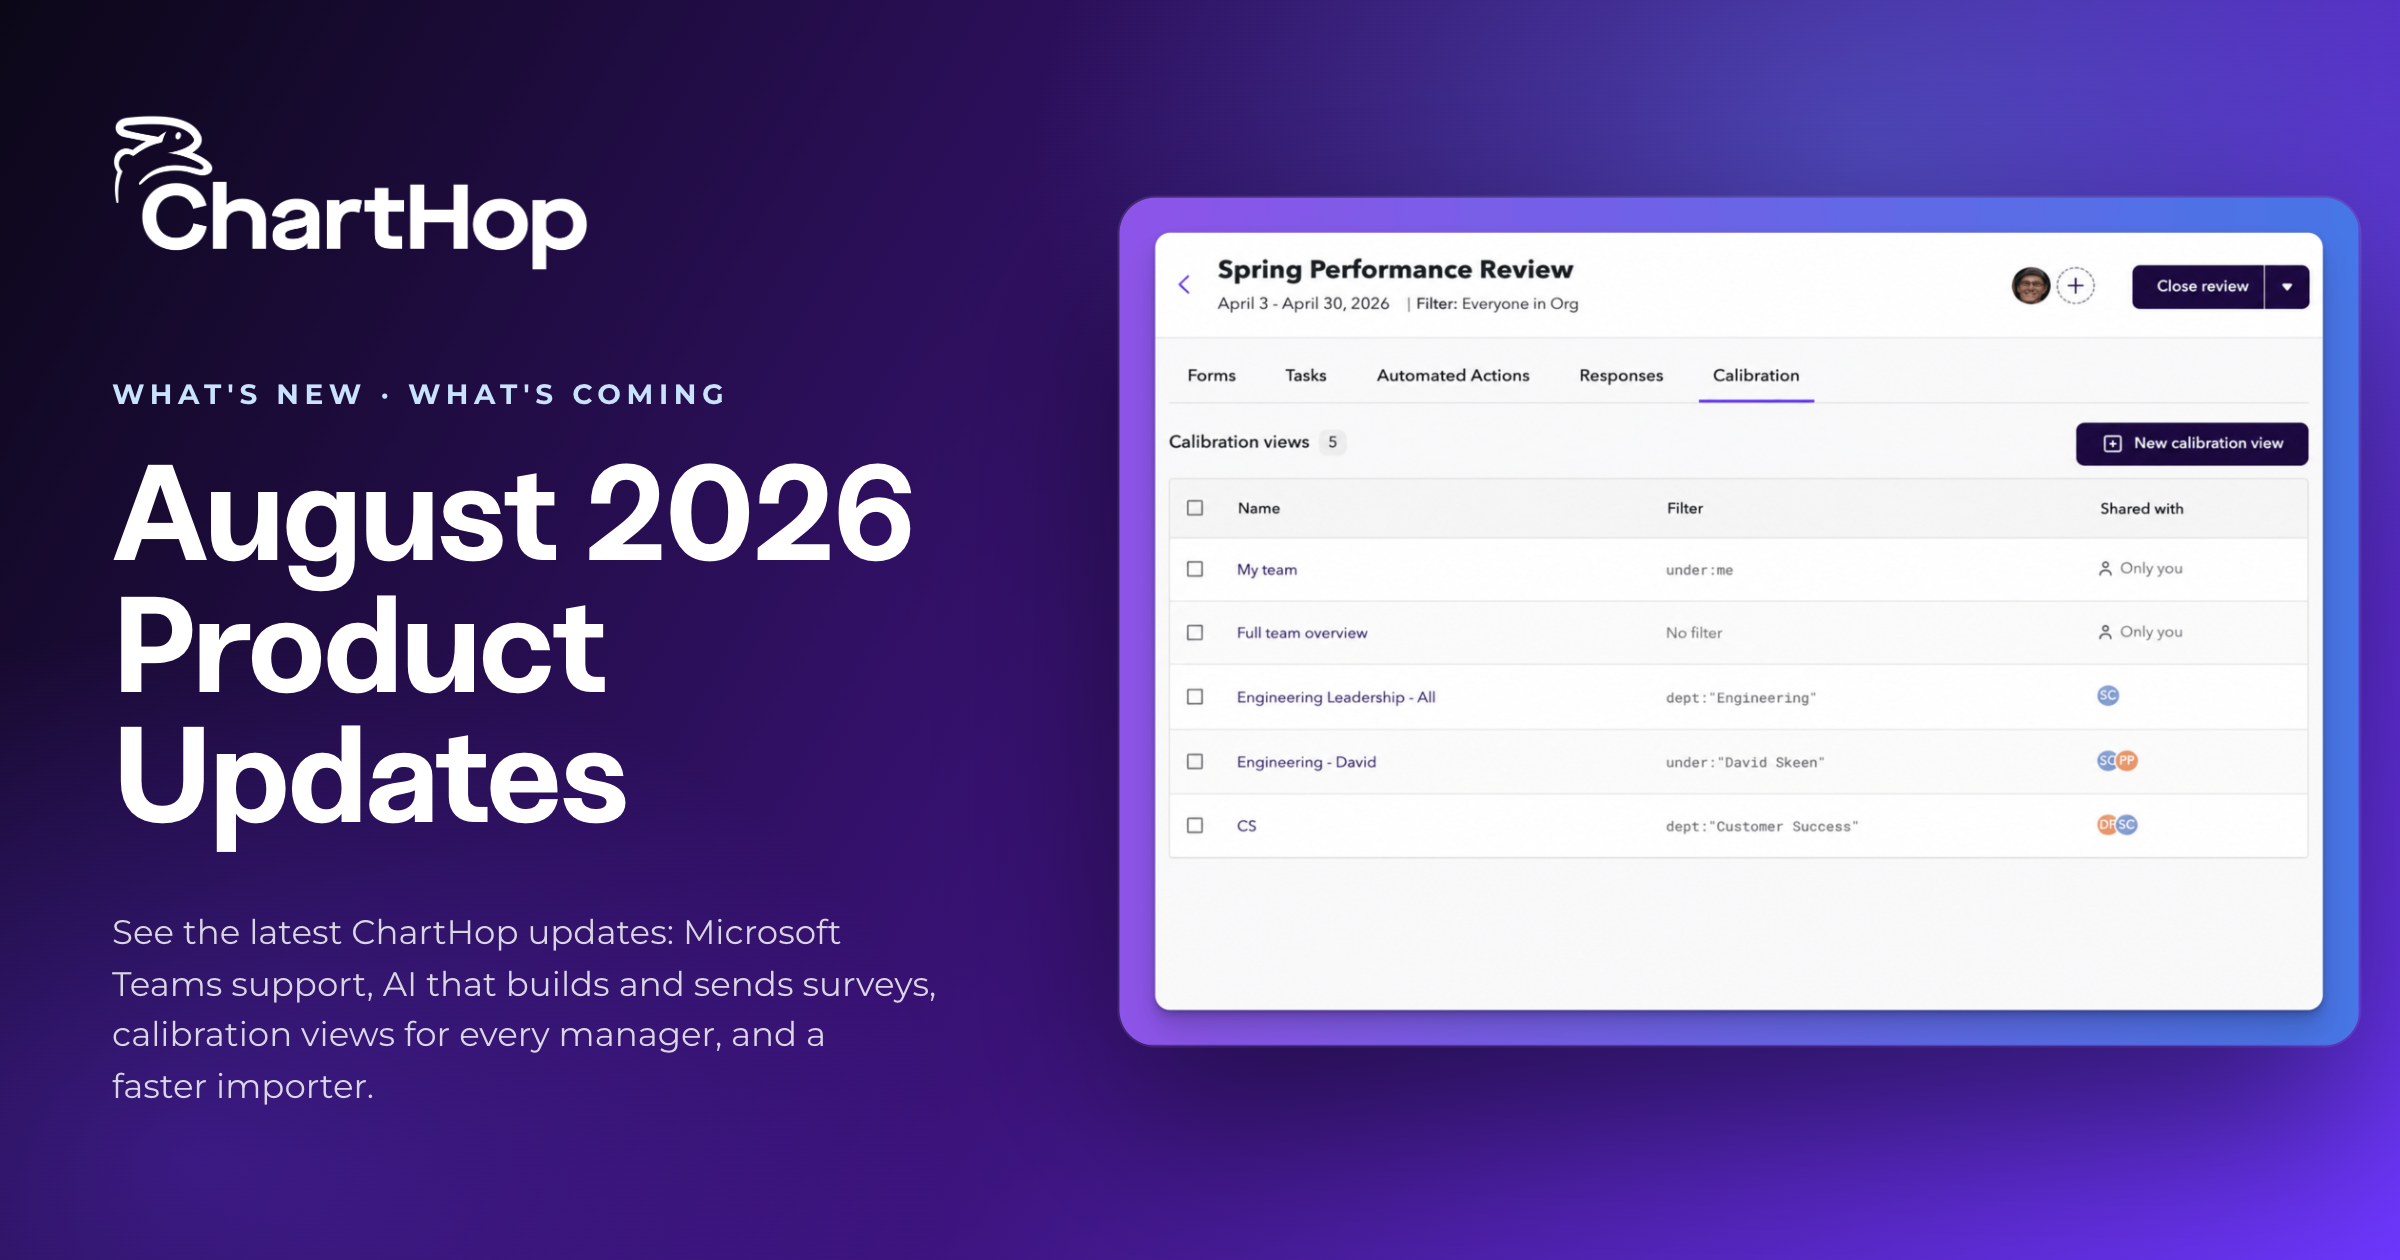

See the latest ChartHop updates for August 2026: Microsoft Teams support, AI that builds and sends surveys, calibration views for every manager, and a faster importer.
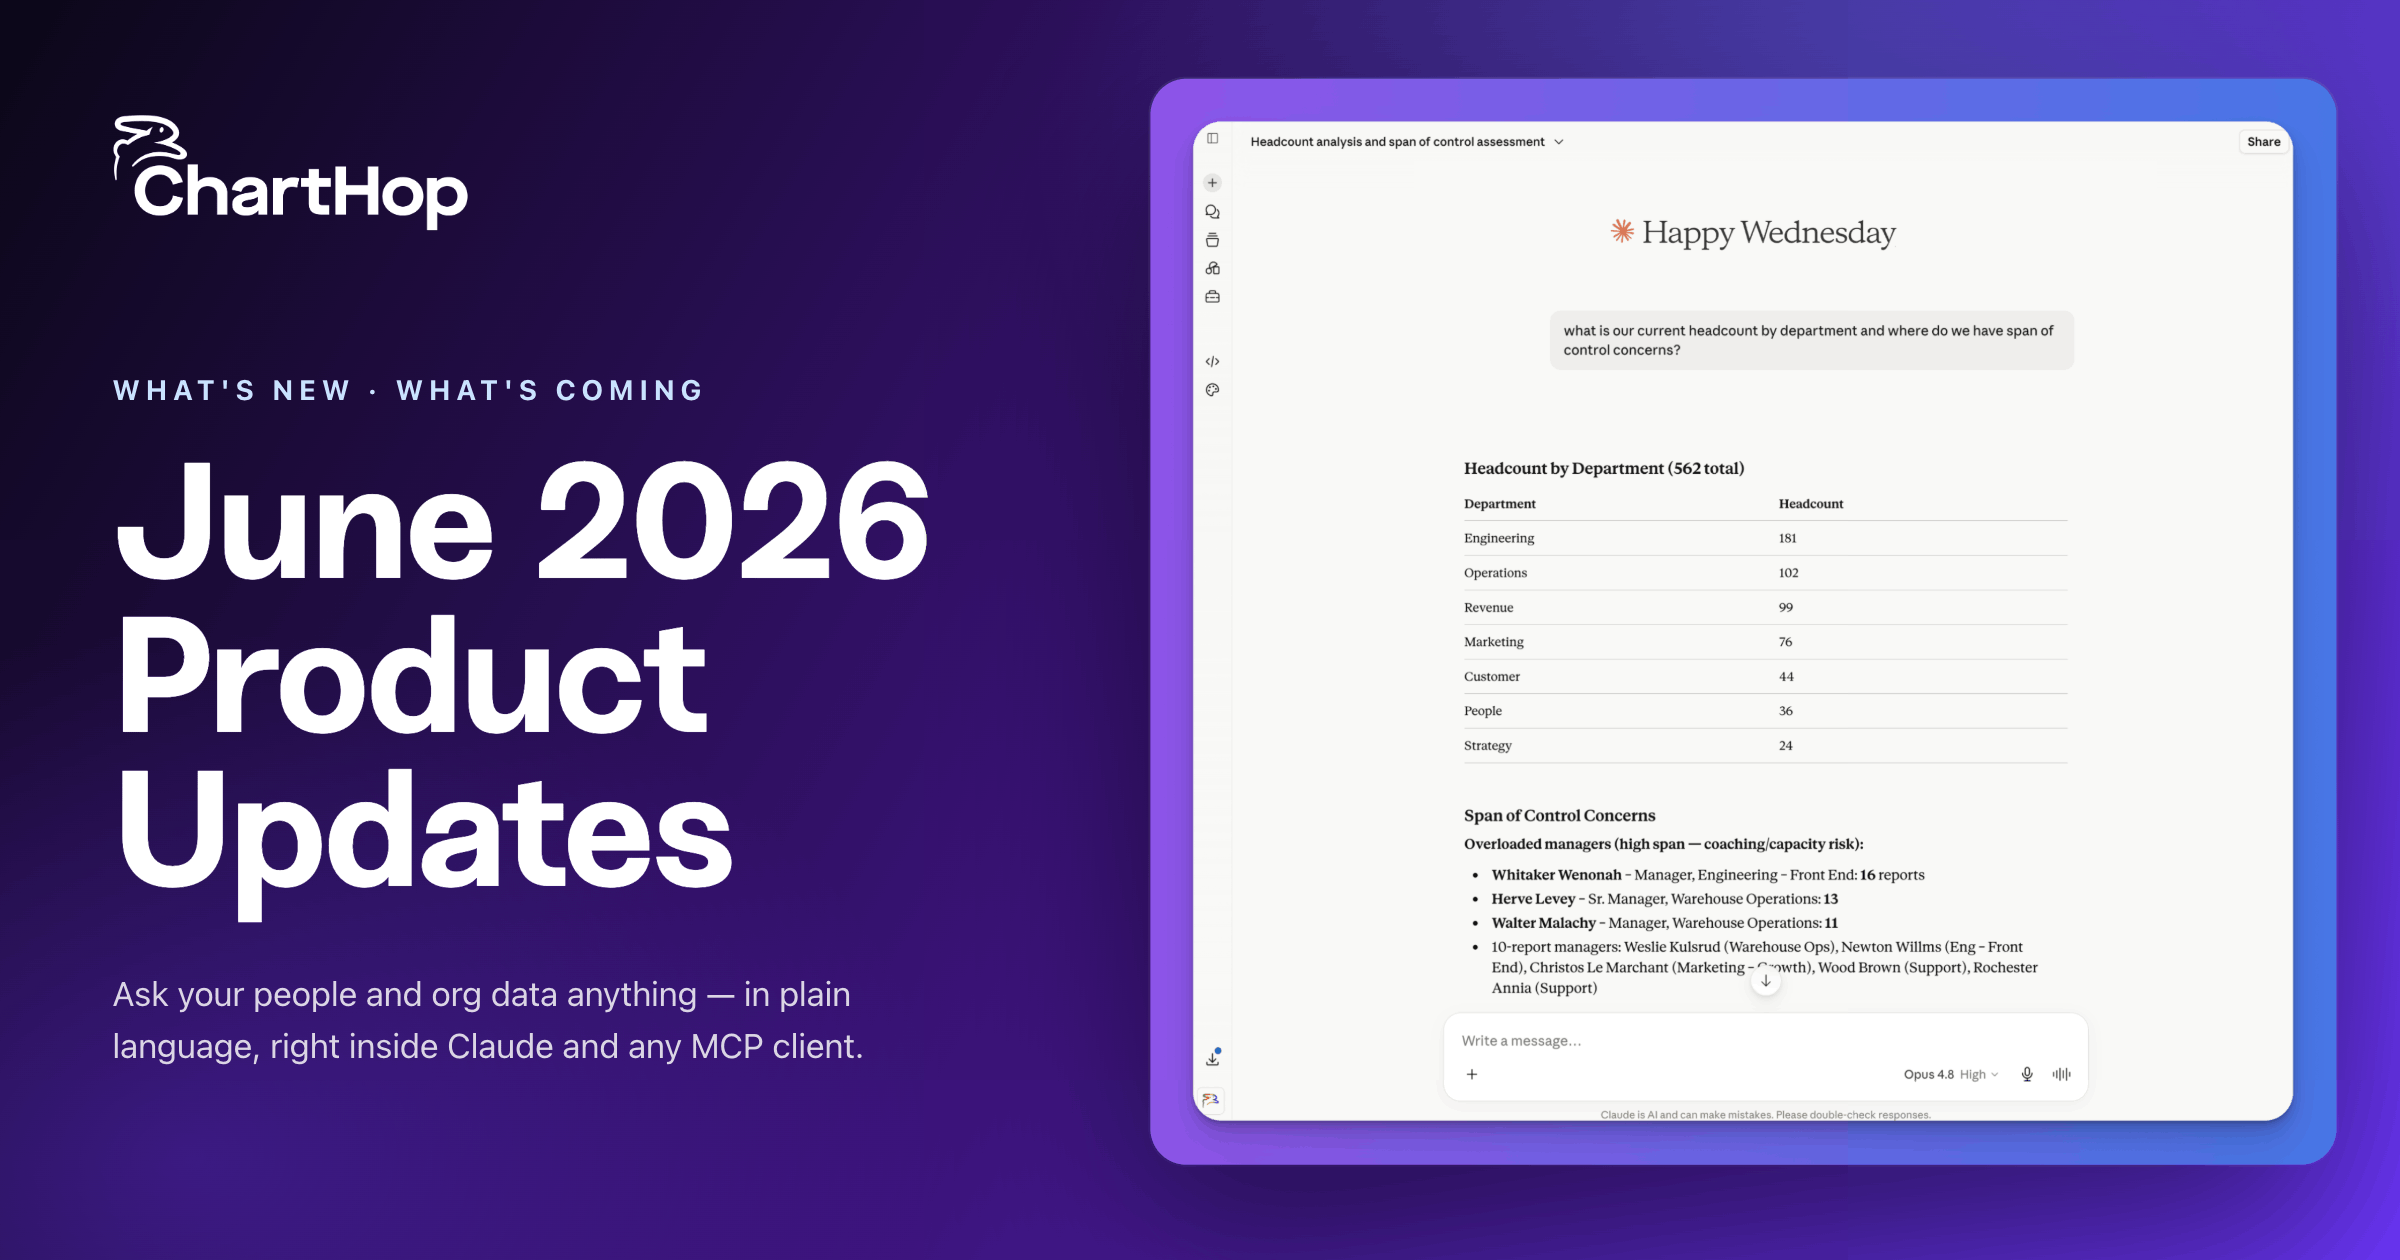
See the latest ChartHop updates: AI Pro agents, a Finance view for headcount planning, a built-in Nine Box, deeper ADP sync, and more.
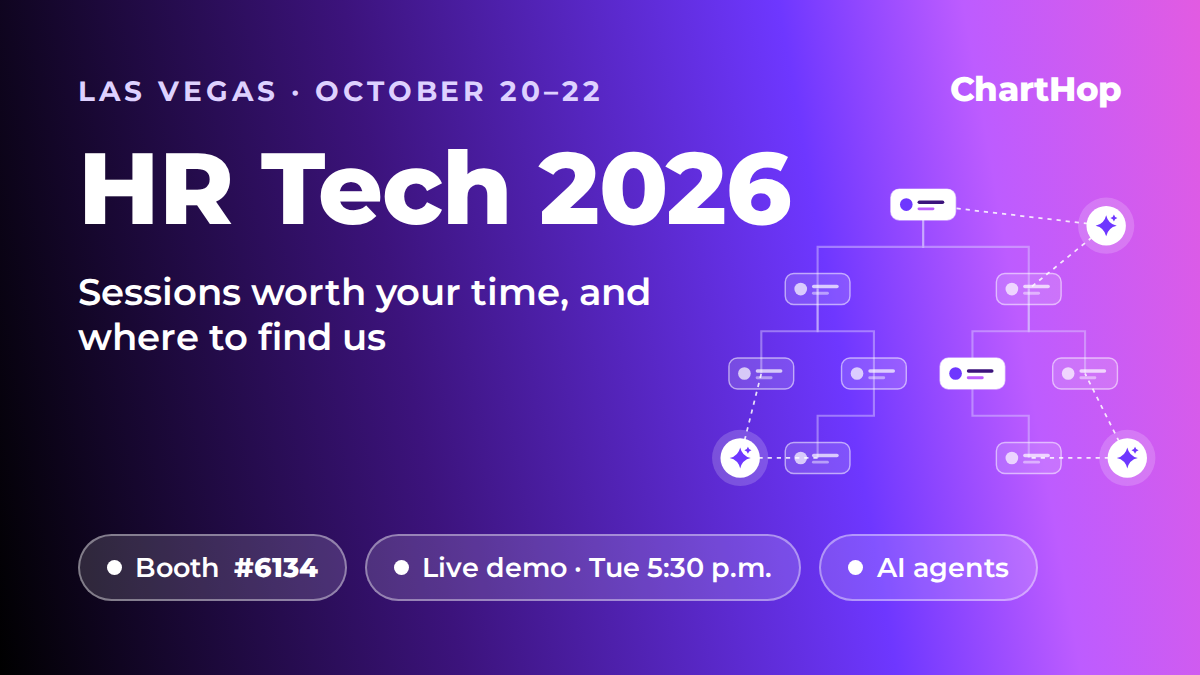
Heading to HR Tech 2026 in Las Vegas? Our take on the show theme, the sessions worth your time, and where to find ChartHop's booth and live demo.
Organizational intelligence is what a company knows about itself, connected in one place and current enough to decide on. Here is where the term came from, the five layers of data it spans, how it differs from workforce intelligence and people analytics, and the test a system should pass before it uses the name.