

To support you in your own DEI efforts, we've put together this comprehensive guide to DEI reporting. The guide is designed to enable you to gain insights into your diversity metrics and build transparency, and accountability, across your organization.
We hope this empowers you to turn data into action and gets us one step closer to the change we want to see. This is part 3 of 4. You can download the full guide below.
There are many ways to analyze DEI data - and it’s easy to get overwhelmed by the sheer amount of data to be collected and analyzed.
Start small: pick a couple of main metrics you want to track and build the corresponding dashboards. With tools like ChartHop, the dashboard building should be the simplest part. For most of these data points, we suggest you track the data over time. Not only will this allow you to understand if and how you’re moving the needle, it’ll also provide the motivation needed for the team to take action.
The goal of visualizing the data is to provide a quick snapshot and surface insights. We’ve put together an example report here with our suggestions - you’ll notice some are stacked bar graphs with numbers, others are normalized stacked bar graphs (meaning every column is at 100%) while others are line graphs that show each dimension individually. Each one serves to communicate data in a different way so play around with the formats that work best for your data and will drive action within your team.

For ChartHop customers, we created a bundle you can install and customize with the charts in the example report.
In response to company’s statements, many have been surfacing images of About Us pages to more starkly illustrate the lack of diversity across leadership roles. Visualizing this data is powerful - images stick in your mind more than numbers, and certainly more than cells in a spreadsheet.
Especially in times of remote work, and as teams restructure in response to COVID, it can be hard to really know what your team looks like. We recommend keeping an updated org chart with pictures.
If you’re a ChartHop customer, you can also highlight your org chart by race and ethnicity or gender to supplement your data and provide a quick view of where you stand. Plus, since the org chart & pictures are automatically updated, this requires no manual work from your team.

This is a sample organization highlighted by race and ethnicity.
If you have multiple offices, we also recommend you keep org charts for each location. After all, representation is important both across the company and within physical spaces. If you’re a ChartHop customer, you can also view this information on the Map.

This is a sample map highlighted by race and ethnicity.
Now that you've collected your data and created your visuals, it's time to share with the broader team.


See how an HRIS and HCM differ, the core modules to expect, and 5 criteria mid-market teams should weigh before buying. Compare the top platforms for 2026.
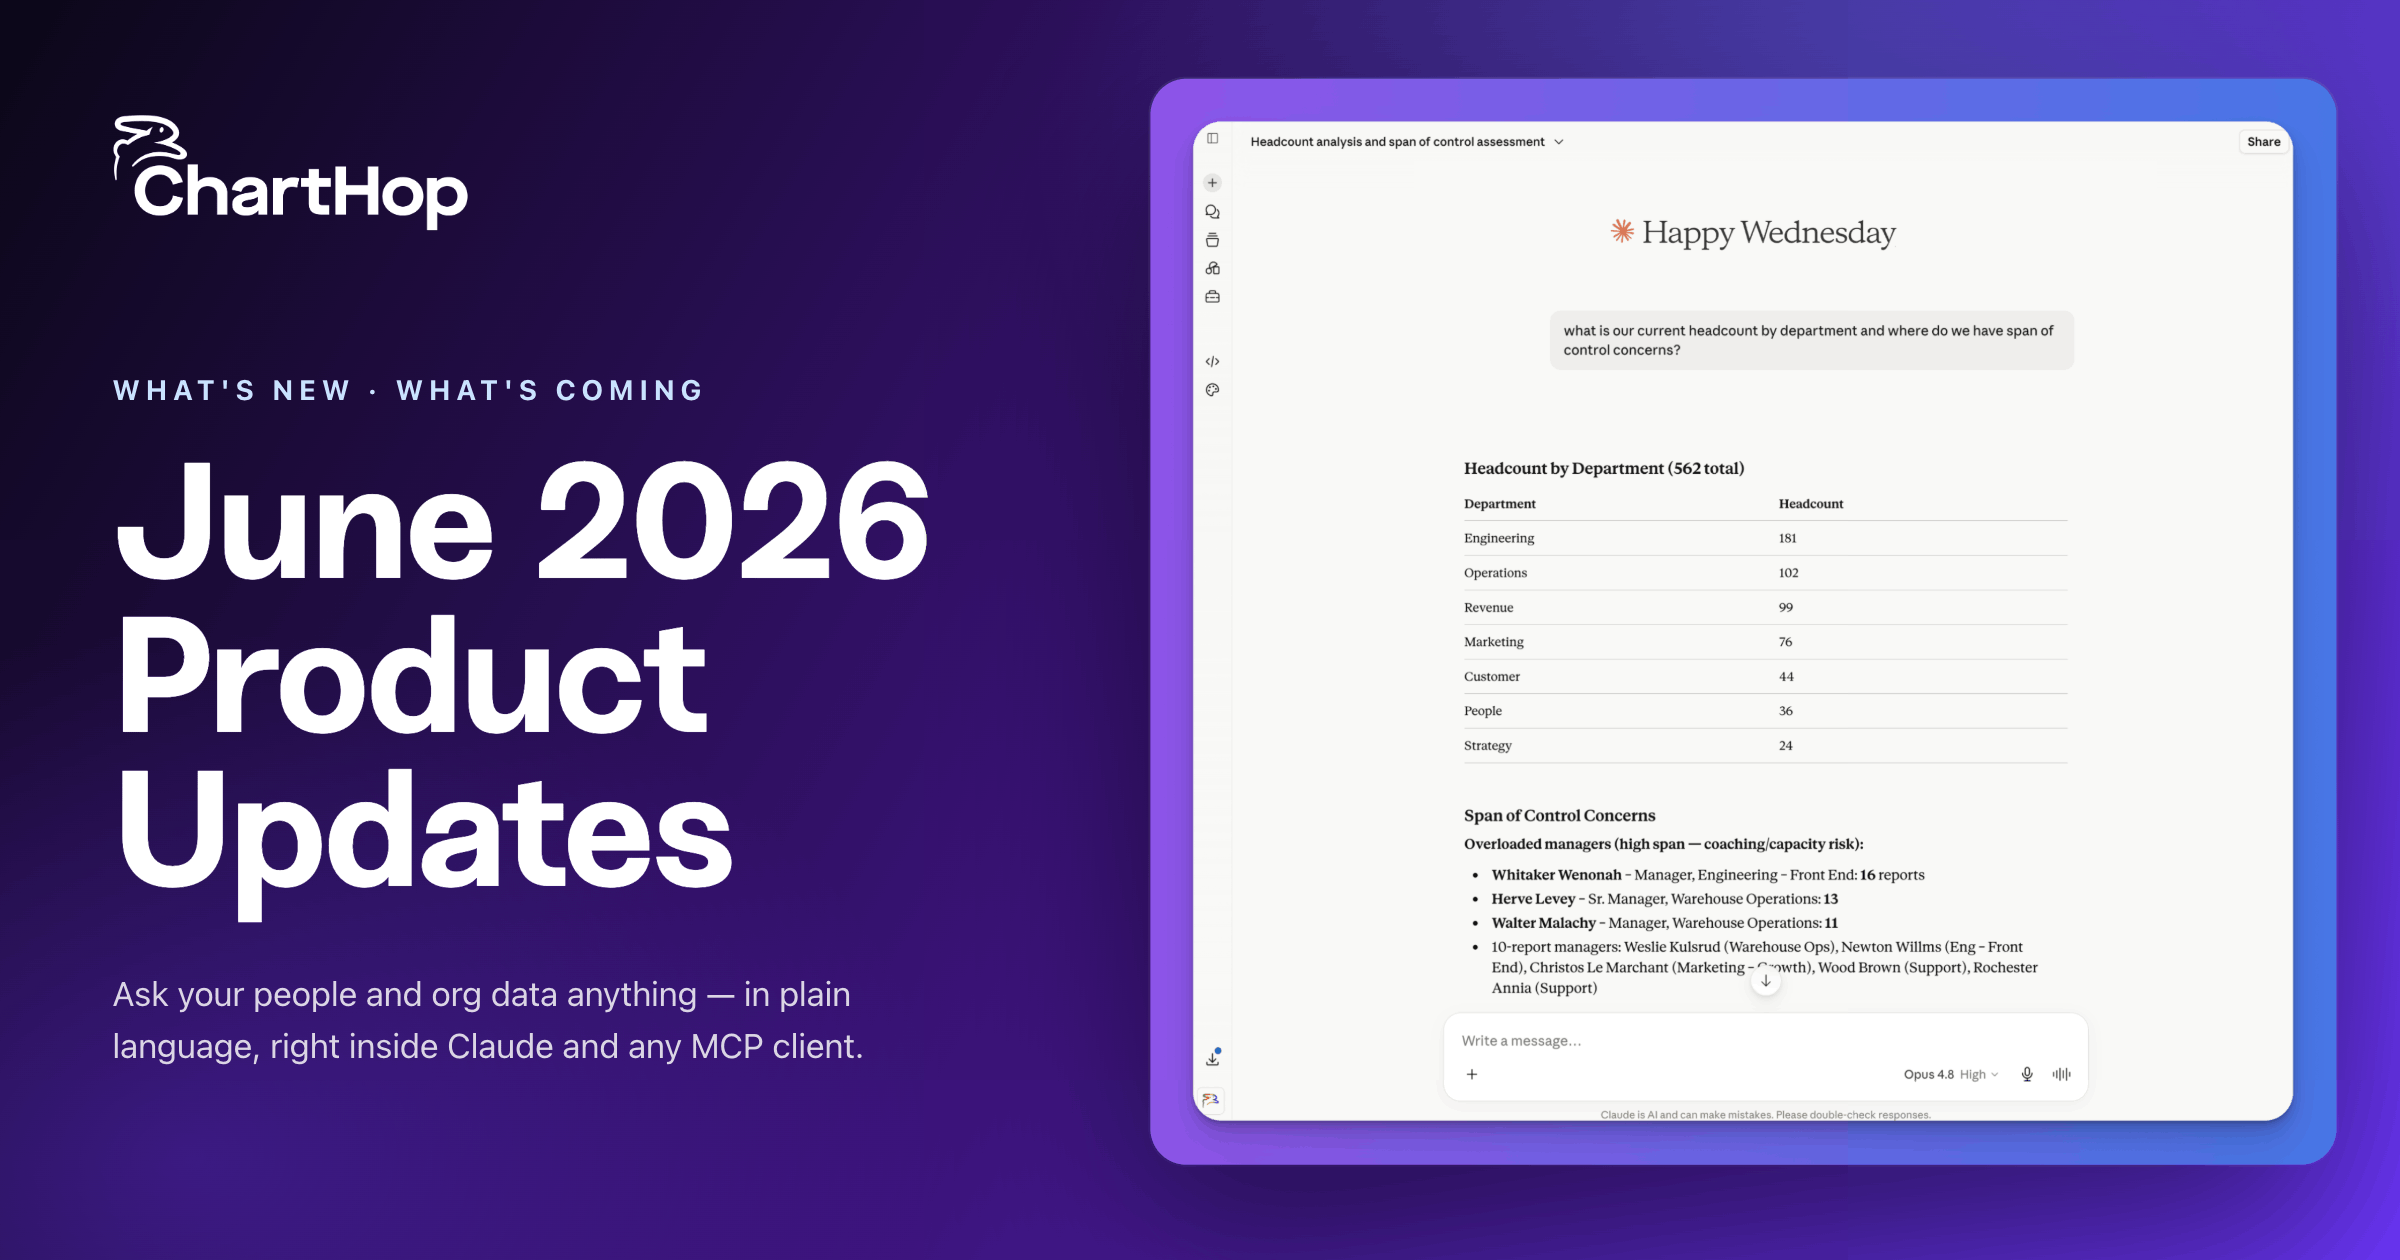
See the latest ChartHop updates: AI Pro agents, a Finance view for headcount planning, a built-in Nine Box, deeper ADP sync, and more.

Greenhouse named ChartHop a Preferred Partner for 2026. What it means, and why connecting your recruiting data to your workforce plan kills the spreadsheet for good.

