
BetterCloud is a fast-growing software company with over 330 employees in six locations. Its aim is to create customer-like experiences for its employees; however, the legacy HR systems in use were not conducive to this.
“Most HR systems are designed for back-office administration, not manager or employee consumption,” said VP, Operations Joe Iantosca, “and our employees deserve better.”
BetterCloud embarked on a quest to find a system that would show the company directory to all employees to better prepare them to connect with a growing team and also to support the semi-annual compensation planning process. It selected ChartHop—at the time in its startup phase—a platform company that pulls all people data into one place. “ChartHop’s CEO Ian was a great partner from the get-go. They grew with us and developed the product based on what we needed to run our business better,” Iantosca continued.
ChartHop easily integrated with ADP, BetterCloud’s HR and payroll system, and brought instant benefits to employees who were visualizing their organization and structure.
Employees appreciate the transparency, visual display, and ease of use. “We showcase the directory on day one of employee orientation. It helps new team members better prepare for meetings by providing an understanding of their colleagues’ roles and areas of responsibility,” Iantosca explained.
Out of the box, the analytics from the system were useful to answer basic questions like number of people per location, open headcount, and more. Previously, it was impossible to get meaningful insights about employees or teams.
This information was useful because BetterCloud needed a system to support its semiannual compensation planning process. This process was challenging because managers needed to understand the philosophy, budgets, guidelines, and common communication practices.
When everything was laid out in an org chart, managers had an easy time going through approvals, reviews, and sign off. Supporting the compensation committee was no longer a daunting proposition.
Using visual analytics allowed managers and leaders to track budget compliance and understand how funding was allocated across different teams. People adopted the new way to do compensation planning because the visuals really resonated with them.
BetterCloud wanted to ensure its process was equitable and fair. It deployed a survey to its 330+ employees to collect key demographics around ethnicity, sexual orientation, family status, and other typically confidential information. Only a small group of internal people see demographic data on the individual level, and BetterCloud communicated the use and need for this data clearly. As a result, more than 90% of people provided their information.
2011
Information Technology & Services
Remote-first
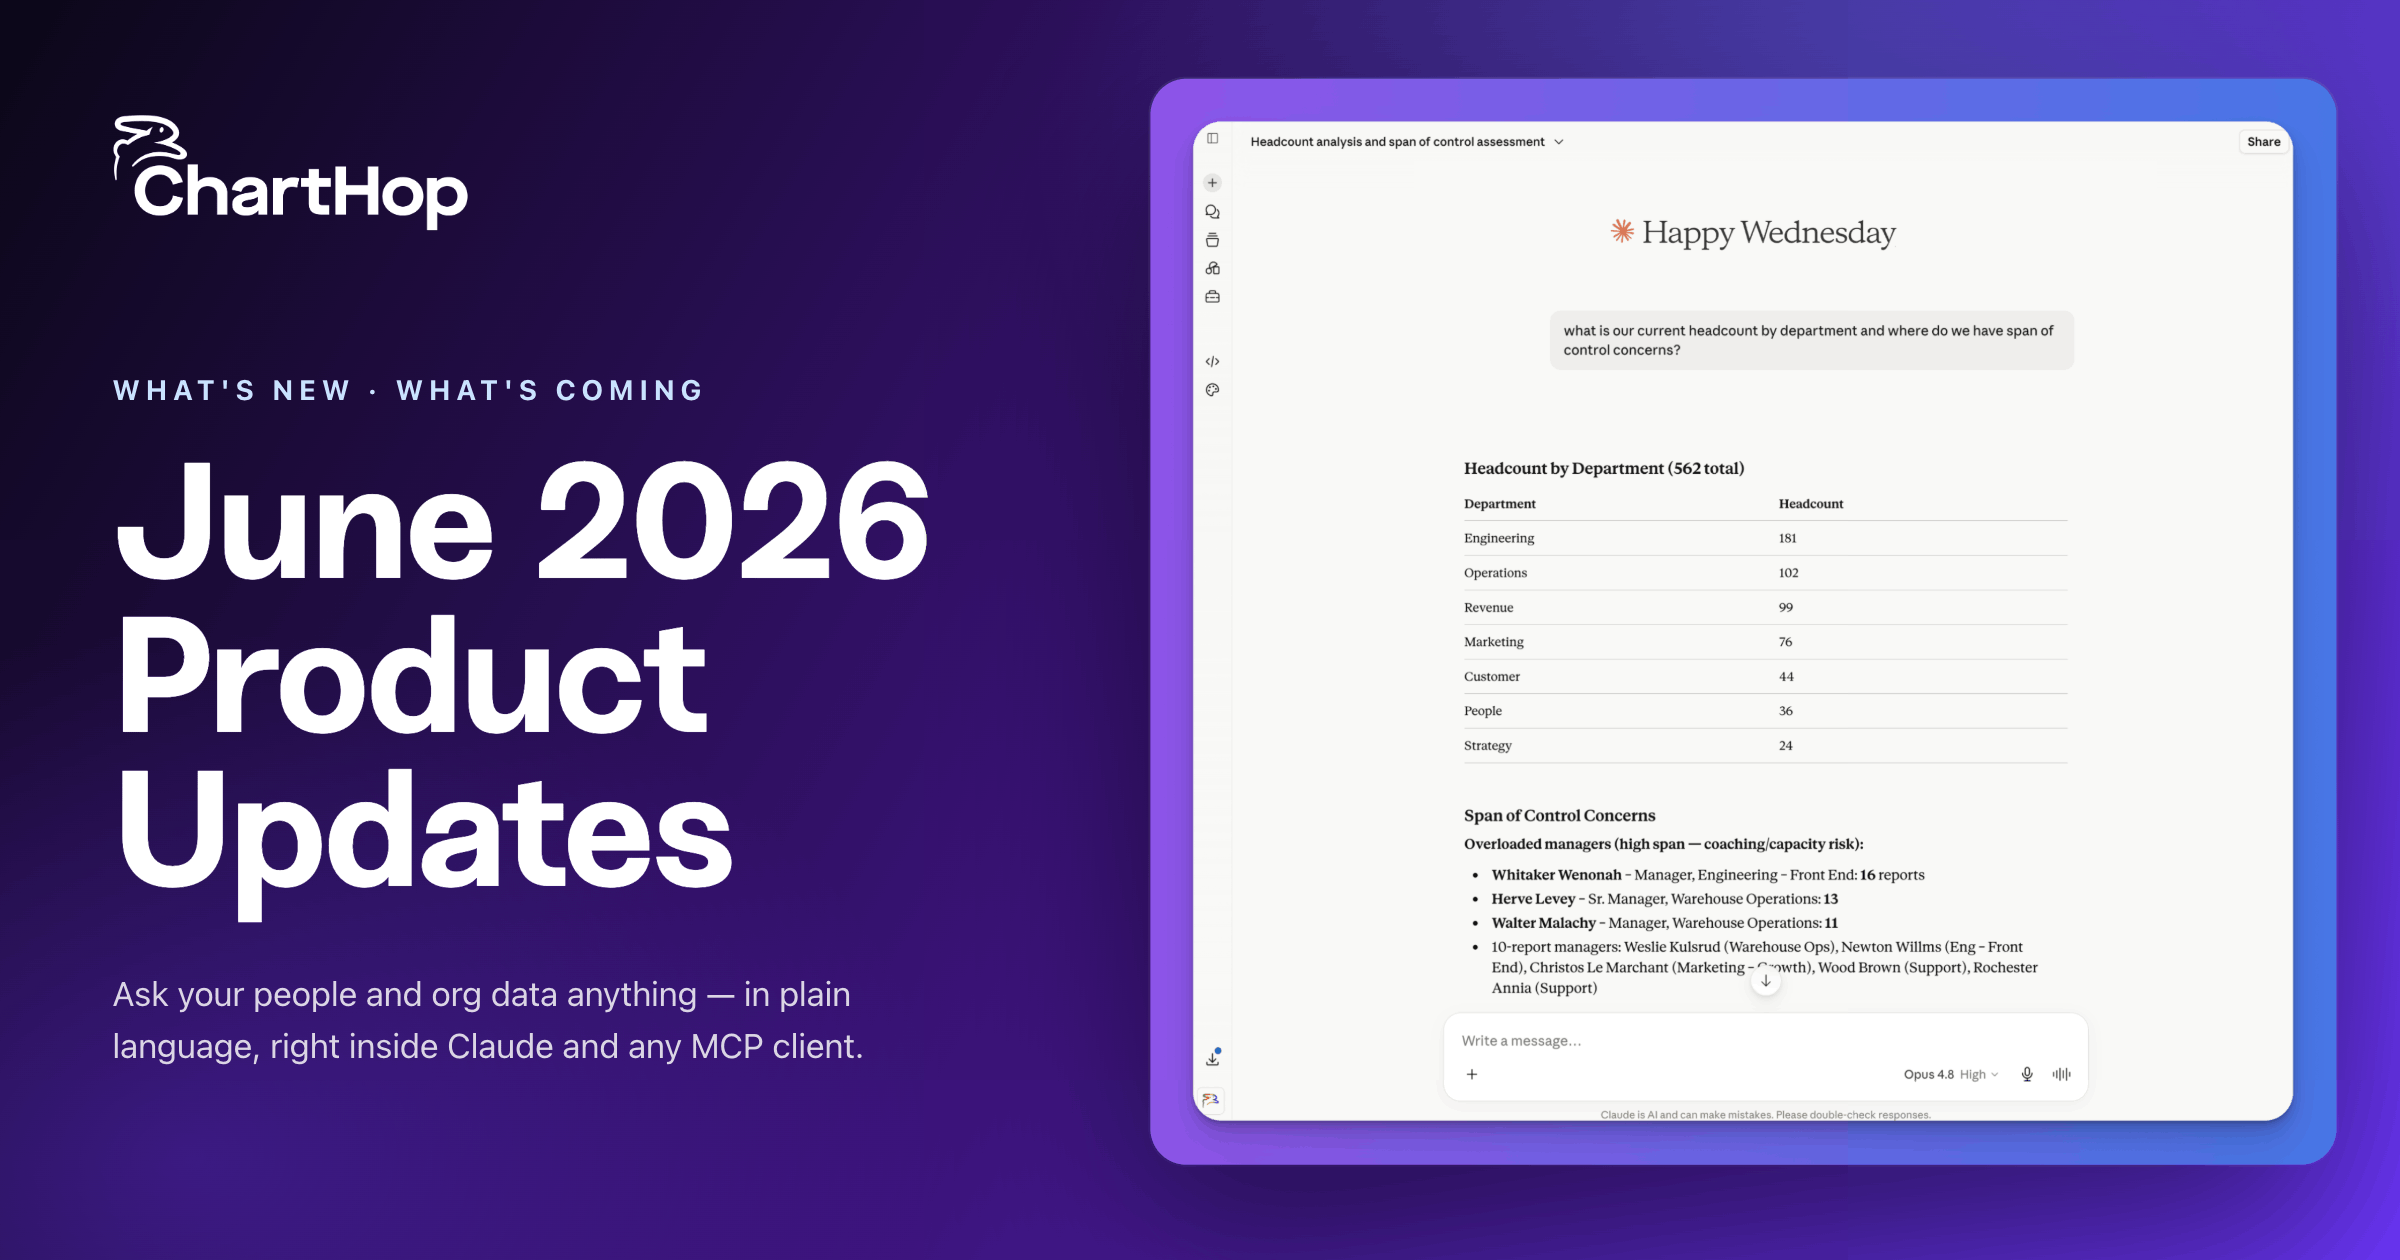

See the latest ChartHop updates: AI Pro agents, a Finance view for headcount planning, a built-in Nine Box, deeper ADP sync, and more.

Greenhouse named ChartHop a Preferred Partner for 2026. What it means, and why connecting your recruiting data to your workforce plan kills the spreadsheet for good.

Finance teams lose hours every month reconciling headcount data between HR systems and budget models. ChartHop connects live HRIS data, headcount plans, and financial forecasts in a single platform so Finance and HR always work from the same numbers. FP&A teams get real-time budget vs. actuals tracking, scenario modeling for hiring freezes and reorgs, and configurable approval workflows that enforce budget discipline without slowing down decisions.

