
We also believe that to build a better, more equitable future, all of us need to know where we stand. That's why the Charting Better Workplaces report aims to shine a light on wage gaps in the tech industry.
Companies use ChartHop to manage their orgs and people data, giving ChartHop unprecedented access to real-time salary, equity, demographic and organizational structure data. For this report, we aggregated and anonymized the data of more than 16,000 employees from private and public tech companies.
UnlikeCharting Better Workplaces, most existing reports are built off of self-reported and/or assumed data, focus on one part of compensation, or don't speak to organizational data at all. We're excited to share this report as a new perspective on wage gap data.
Let's use this data to chart a course toward better, more equitable workplaces.
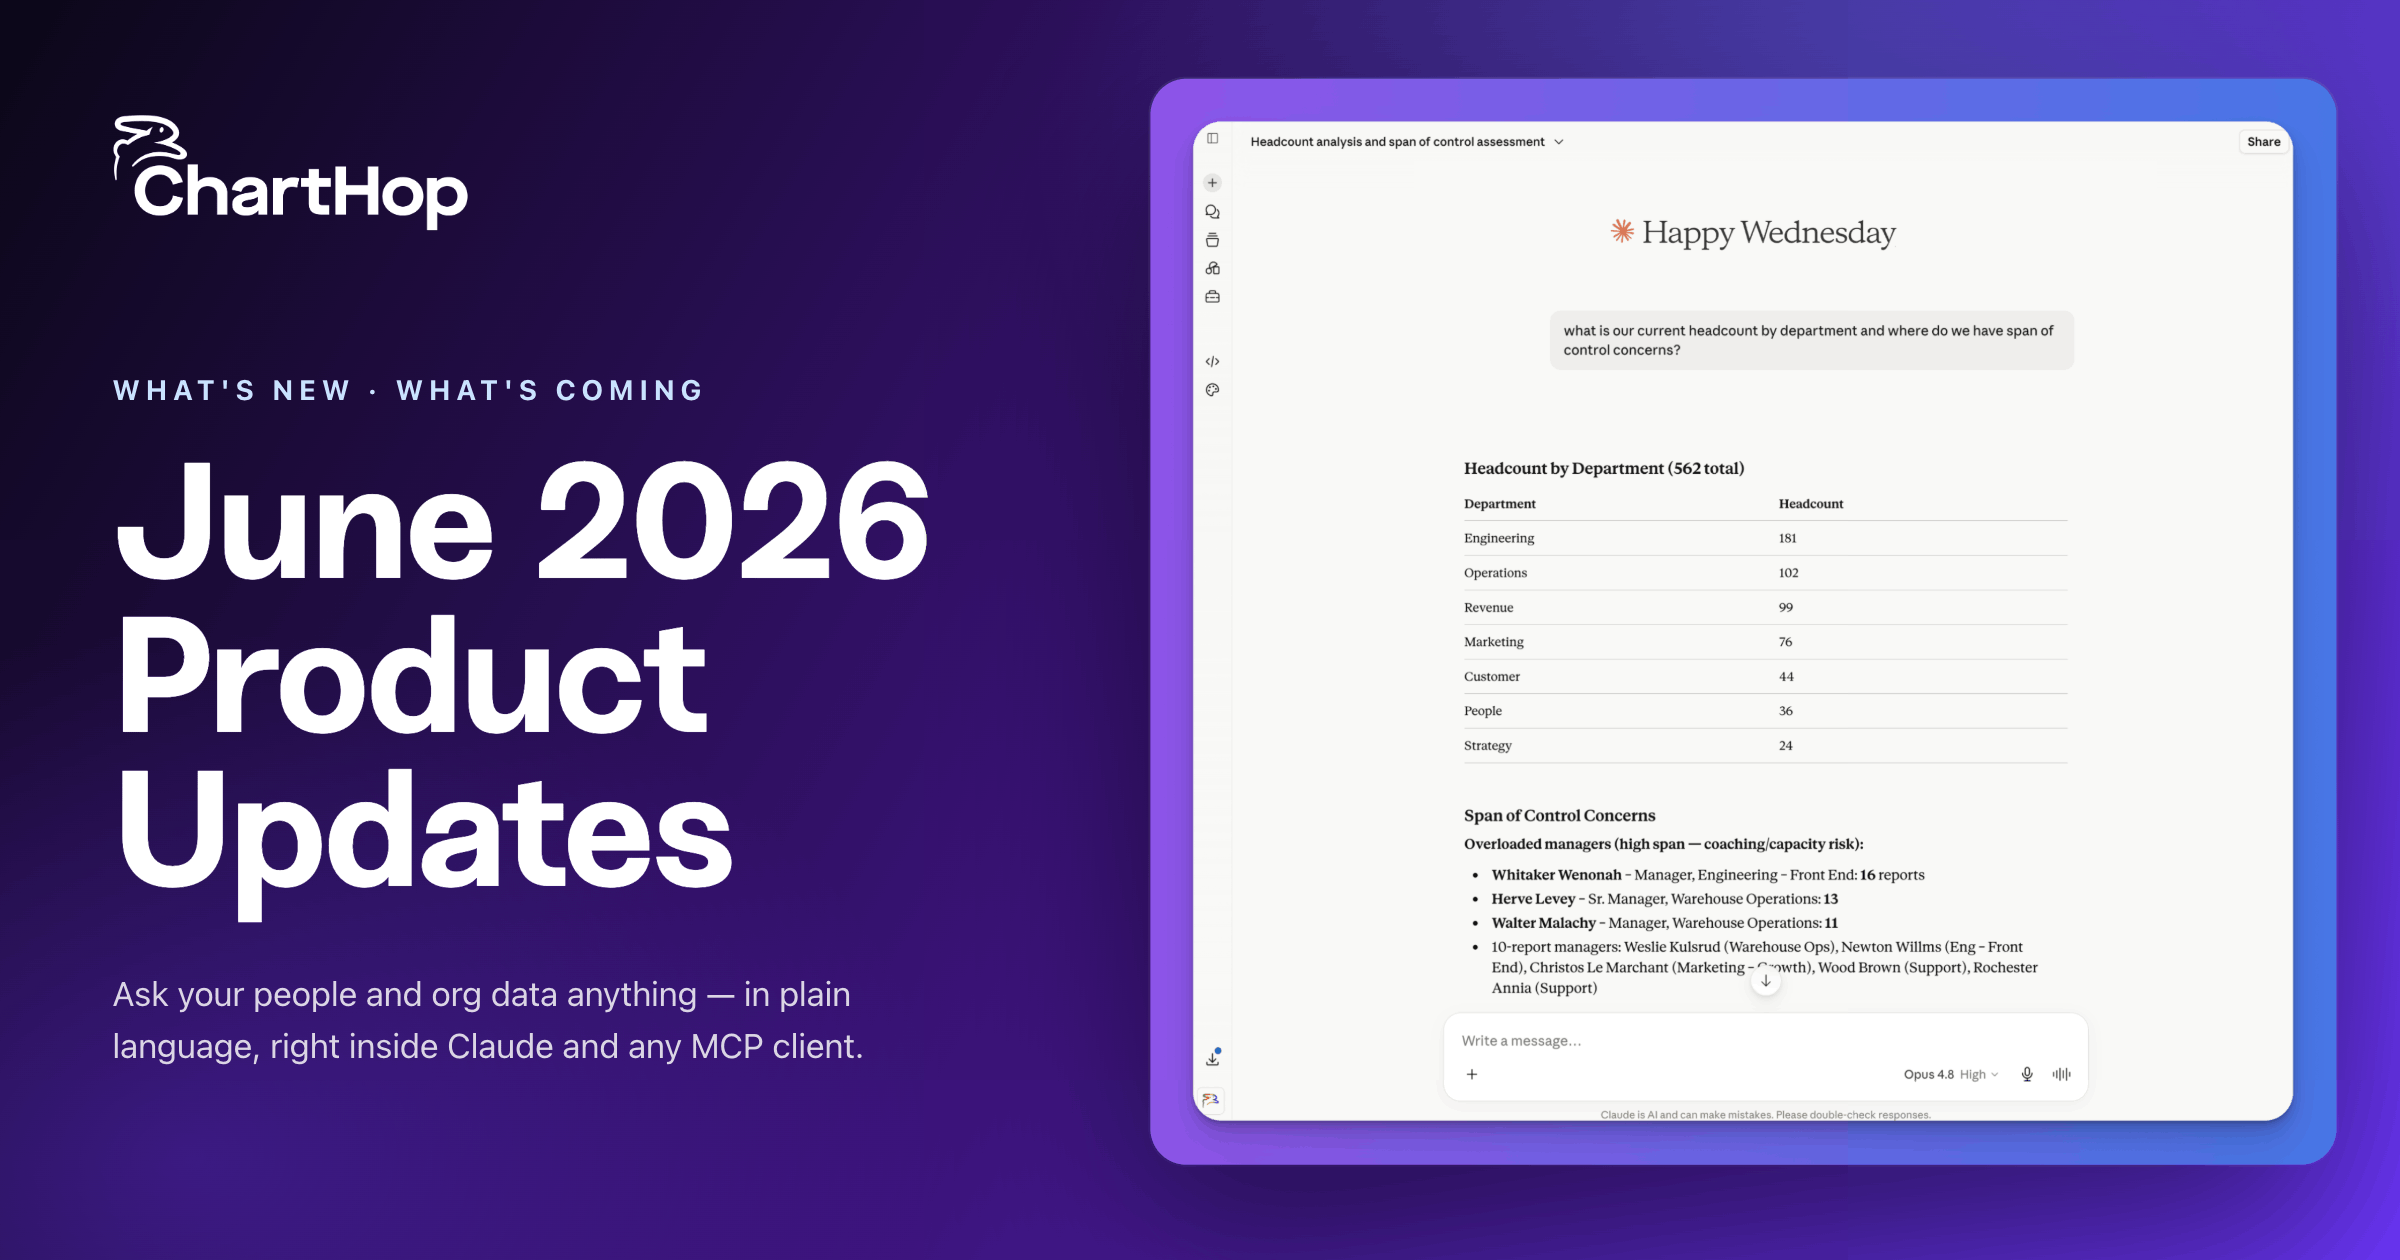

See the latest ChartHop updates: AI Pro agents, a Finance view for headcount planning, a built-in Nine Box, deeper ADP sync, and more.

Greenhouse named ChartHop a Preferred Partner for 2026. What it means, and why connecting your recruiting data to your workforce plan kills the spreadsheet for good.

Finance teams lose hours every month reconciling headcount data between HR systems and budget models. ChartHop connects live HRIS data, headcount plans, and financial forecasts in a single platform so Finance and HR always work from the same numbers. FP&A teams get real-time budget vs. actuals tracking, scenario modeling for hiring freezes and reorgs, and configurable approval workflows that enforce budget discipline without slowing down decisions.

