
This was a milestone year at ChartHop. We strengthened the platform with AI and intelligence at its core, uniting people data and business data in one secure, easy-to-use system. The result for customers? Simple and powerful: better insight, faster decisions, more confident action.
We launched 800 product improvements in 2025. (Yes, you read that right, we're still pinching ourselves too.) From AI that commands the platform to build reports instantly, to mobile apps that put organizational intelligence in everyone's pocket, to integrations that finally connect Salesforce pipeline data with the teams driving those numbers – we couldn't be prouder of what we built together.
None of this would have been possible without our amazing customers and partners. Your feedback, trust, and collaboration remain the foundation of everything we build. So let's dive into some highlights from an unforgettable year.
We dramatically expanded Ask ChartHop in 2025, transforming how customers use the entire platform. In 2024, we introduced Ask ChartHop to our HRIS customers. This year, we made Ask ChartHop available to all customers, bringing AI capabilities across every module, on iOS and Android, and embedded quick insight buttons directly inside dashboards, comp reviews, profiles, planning scenarios, forms, the homepage, and more.
But here's what really changed the game: AI with agentic capabilities that connects people data with business data. Ask ChartHop now pulls from Salesforce pipeline metrics, Zendesk support tickets, and custom business datasets alongside traditional HR information. This means Finance and People teams can finally ask questions like "Show me sales performance based on quotas by territory" or "Which departments handle the highest ticket volumes?" and get instant, accurate answers - no analyst required.
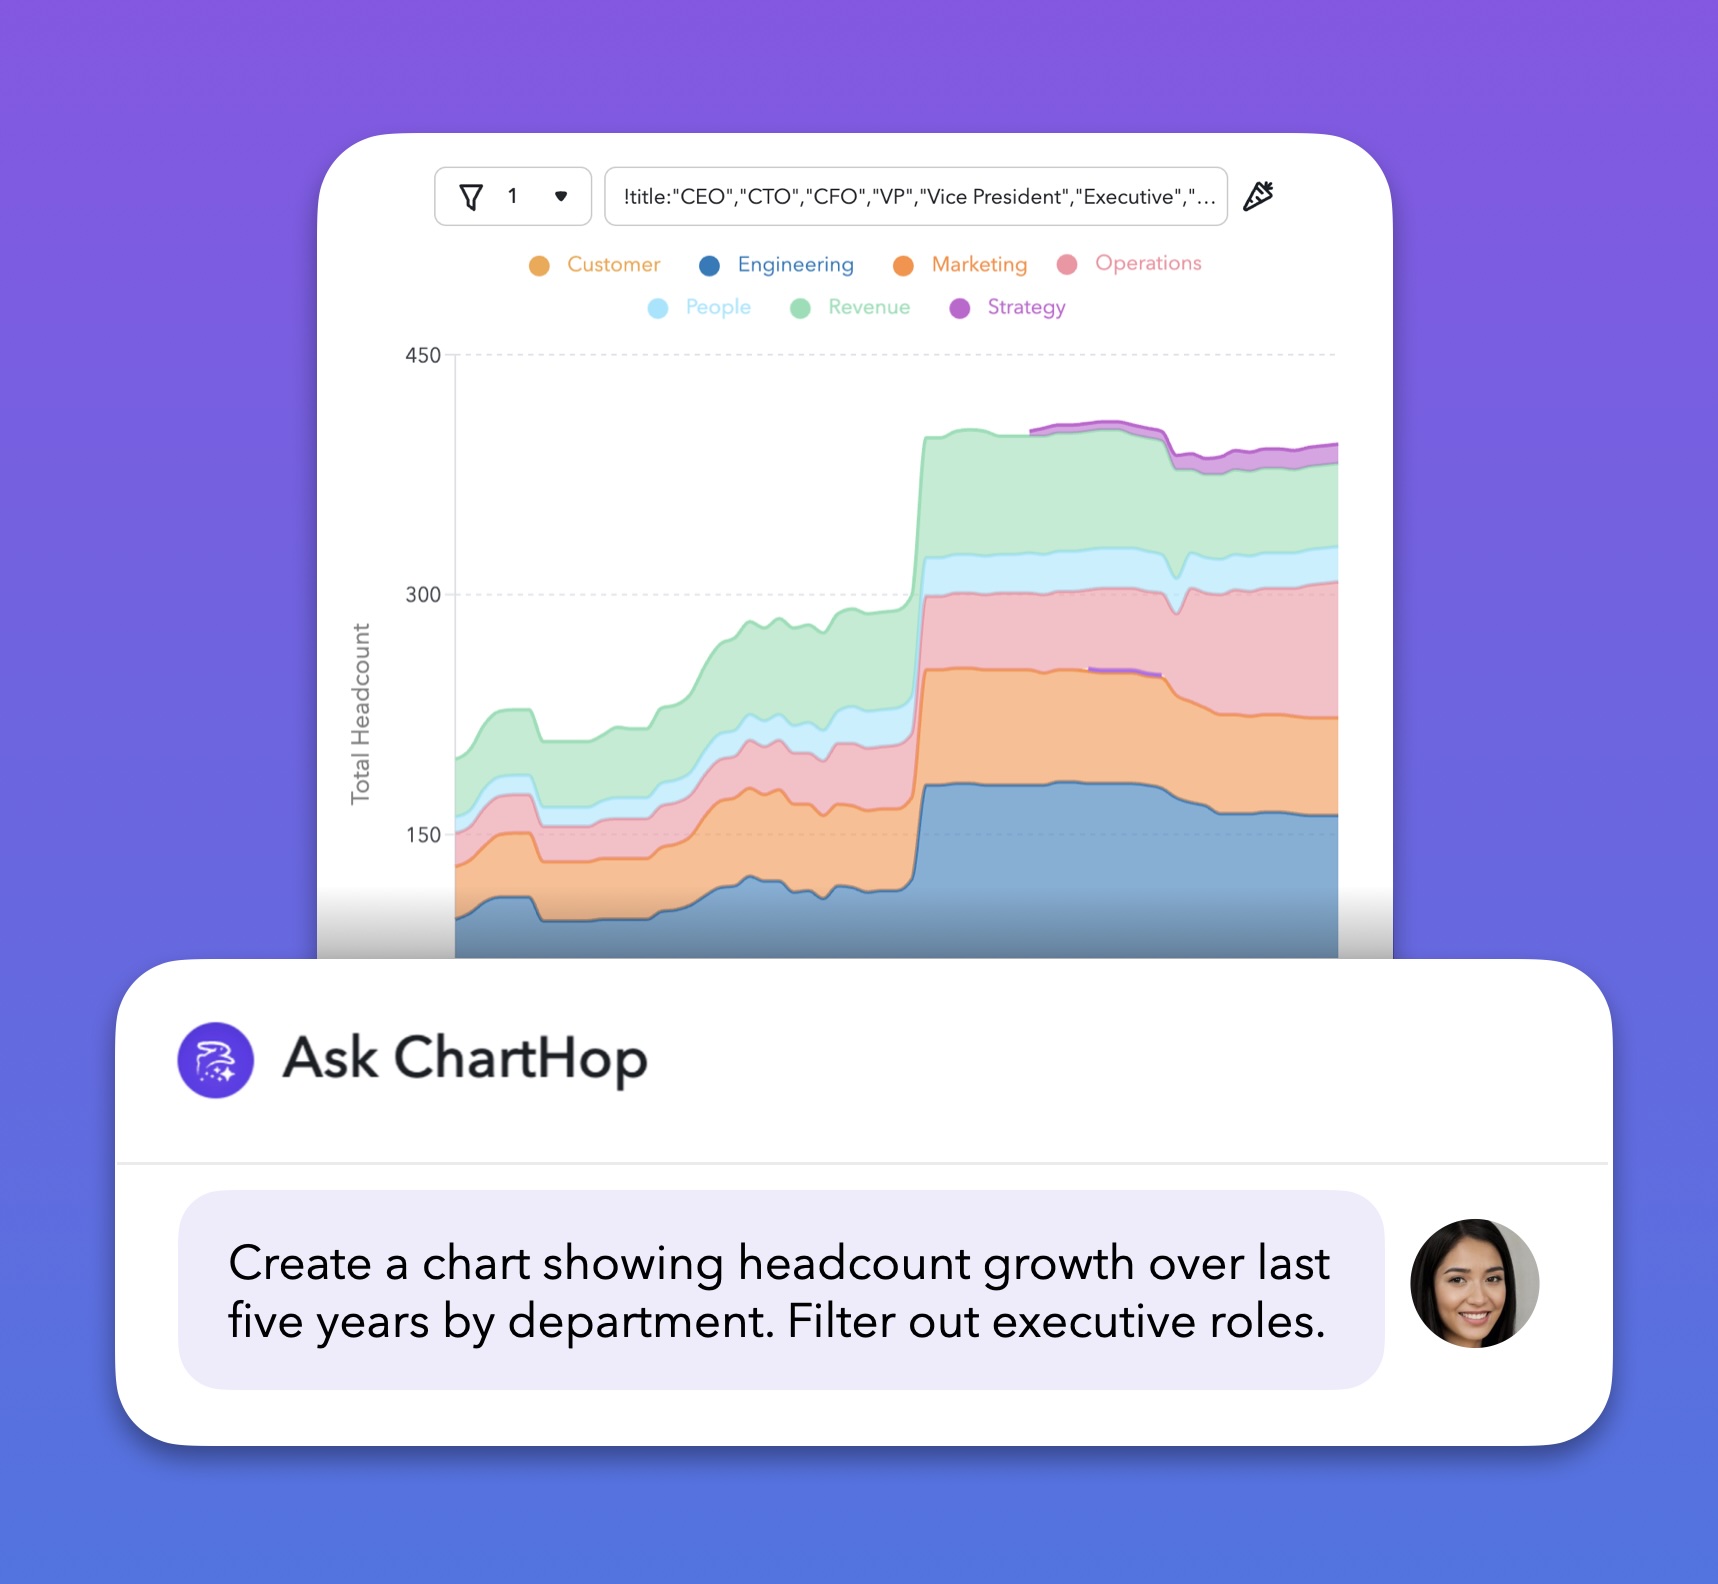
Ask ChartHop’s analysis is powerful but take it a step further by having Ask ChartHop actually generate the report, chart, or graph for you. These aren’t just chat based elements, ChartHop actually generates the report as a Data Sheet, or the chart or graph to build a Dashboard with as if you had built it yourself. All this is done via the chat interface and can even handle complex filters. Need to resume a previous analysis? Chat history lets you pick up right where you left off.
We have also improved the formatting in Ask ChartHop so that the output is more visual: tables, editorial styling, smart entity tags that link to profiles and groups. It's visual organizational intelligence that feels effortless because it is effortless.
"ChartHop AI feels like my personal People Business Partner – always there when I need it. It understands our people and our business, making my job easier and our decisions smarter." — Stefan Premdas, Dir, People Experience
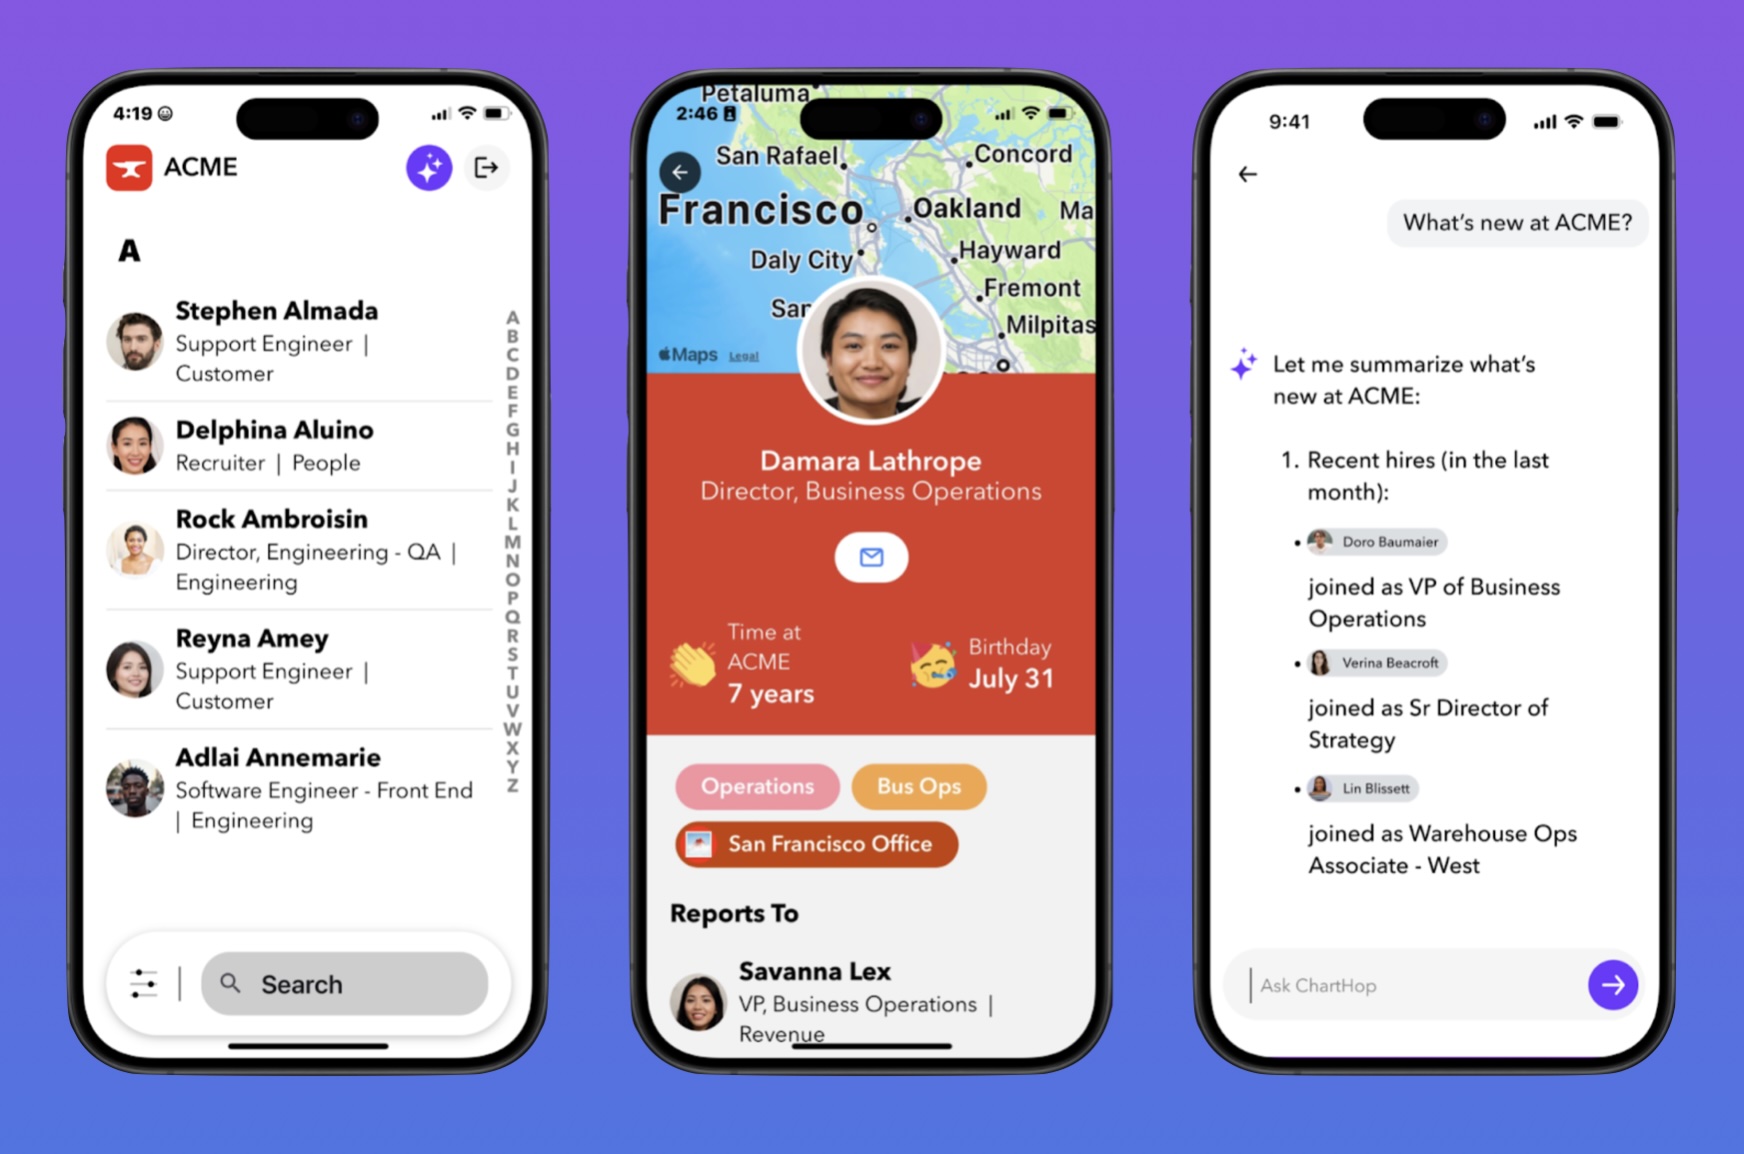
We launched native mobile apps for iOS and Android – and we didn't hold back.
The power of ChartHop now fits in your pocket including access to Ask ChartHop, a company-wide directory with rich filtering, employee profiles with one-tap communication, task and form approvals, time off management for HRIS customers, and even branded digital business cards with scannable QR codes. You can now take ChartHop with you anywhere you need to be.
We also made finding people up to 3x faster with search improvements across departments, locations, custom groups, matrix teams, ERGs, and more. Search by preferred name, legal name, or email – results are instant and accurate every time.
ChartHop is now available in French (EU & Canadian), German, and Spanish. Custom fields, form questions, and even open text survey responses translate automatically with AI (then refine manually if needed). Global companies get inclusive processes, reduced communication barriers, and faster decision-making across distributed teams.
We also completely reimagined Time Off for HRIS customers with multiple policies per location, accrual-based and unlimited plans, carryover functionality, real-time balances, and a full audit ledger. One comprehensive global solution.
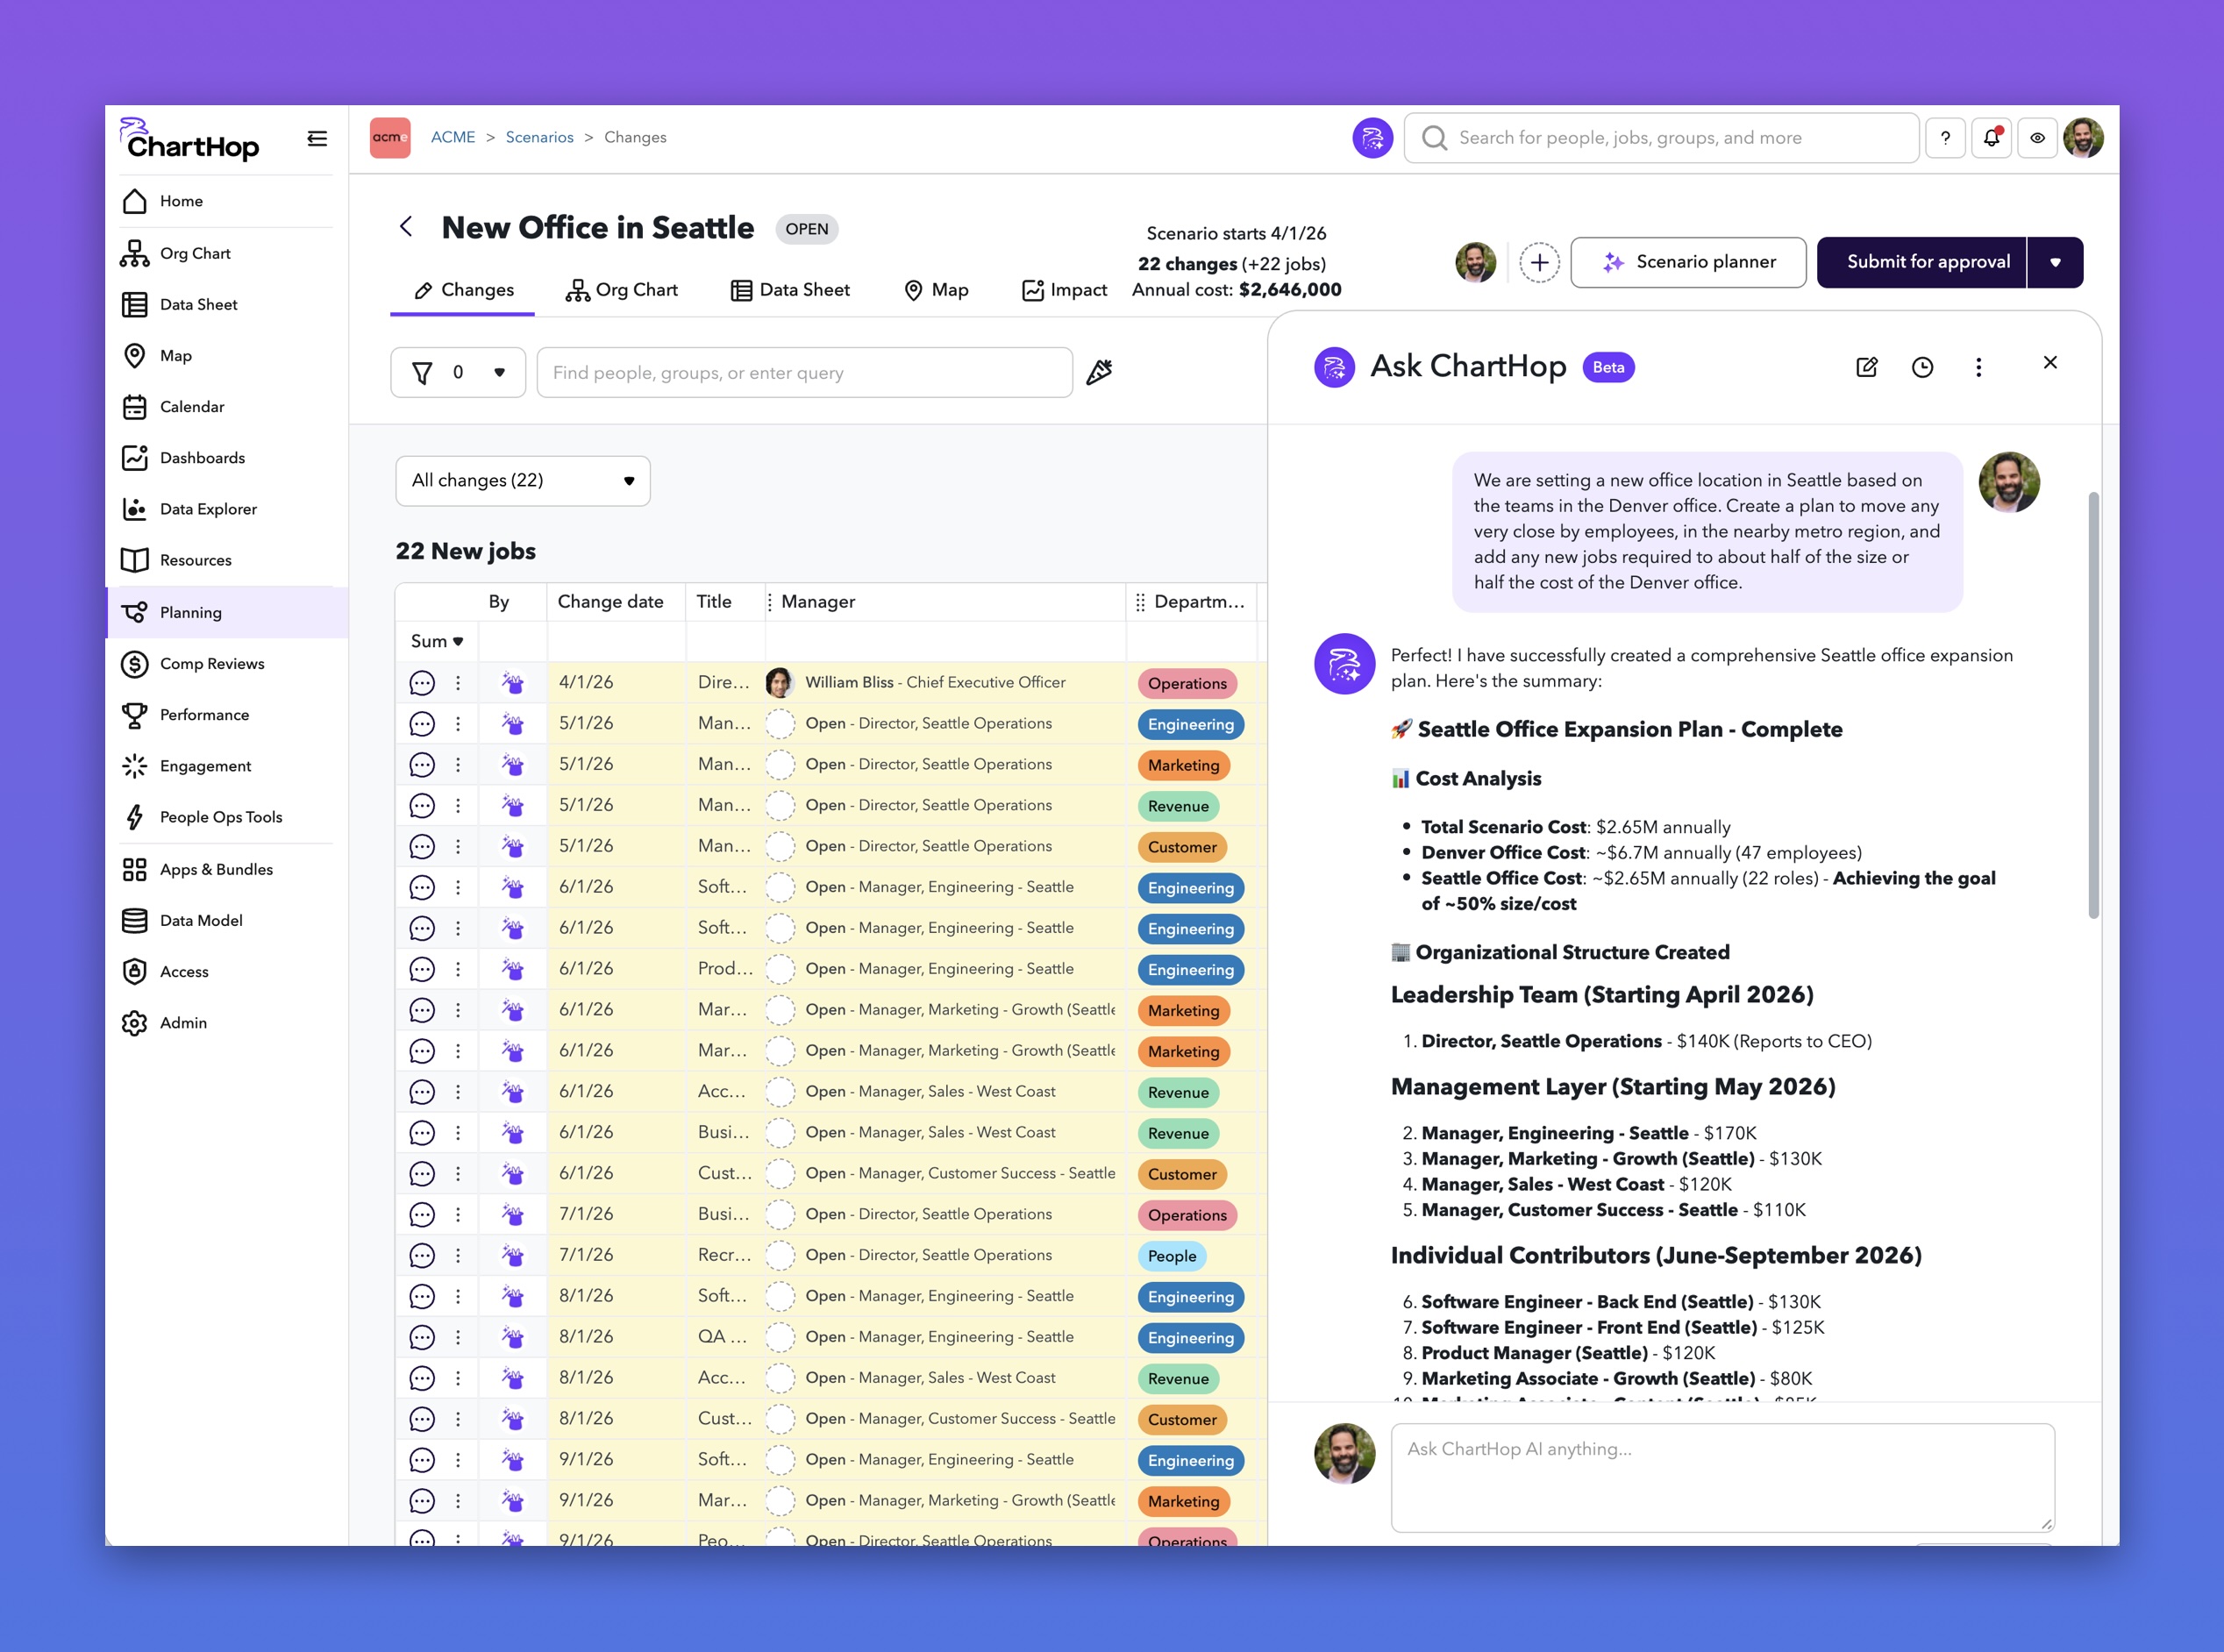
ChartHop Planning got smarter, faster, and more collaborative.
AI Generative Scenarios create draft headcount plans from natural language descriptions, your intelligent starting point in seconds. New customization lets you choose simple multiplier methods or fully custom CQL formulas for precise financial logic. Access-controlled cost visibility means users without comp access can still submit scenarios securely.
Add monthly/weekly/daily pay rates, standardized titles with job code connections to comp bands, and improved in-cycle approval workflows. Planning is now more resilient, more accurate, and powered with organizational intelligence.
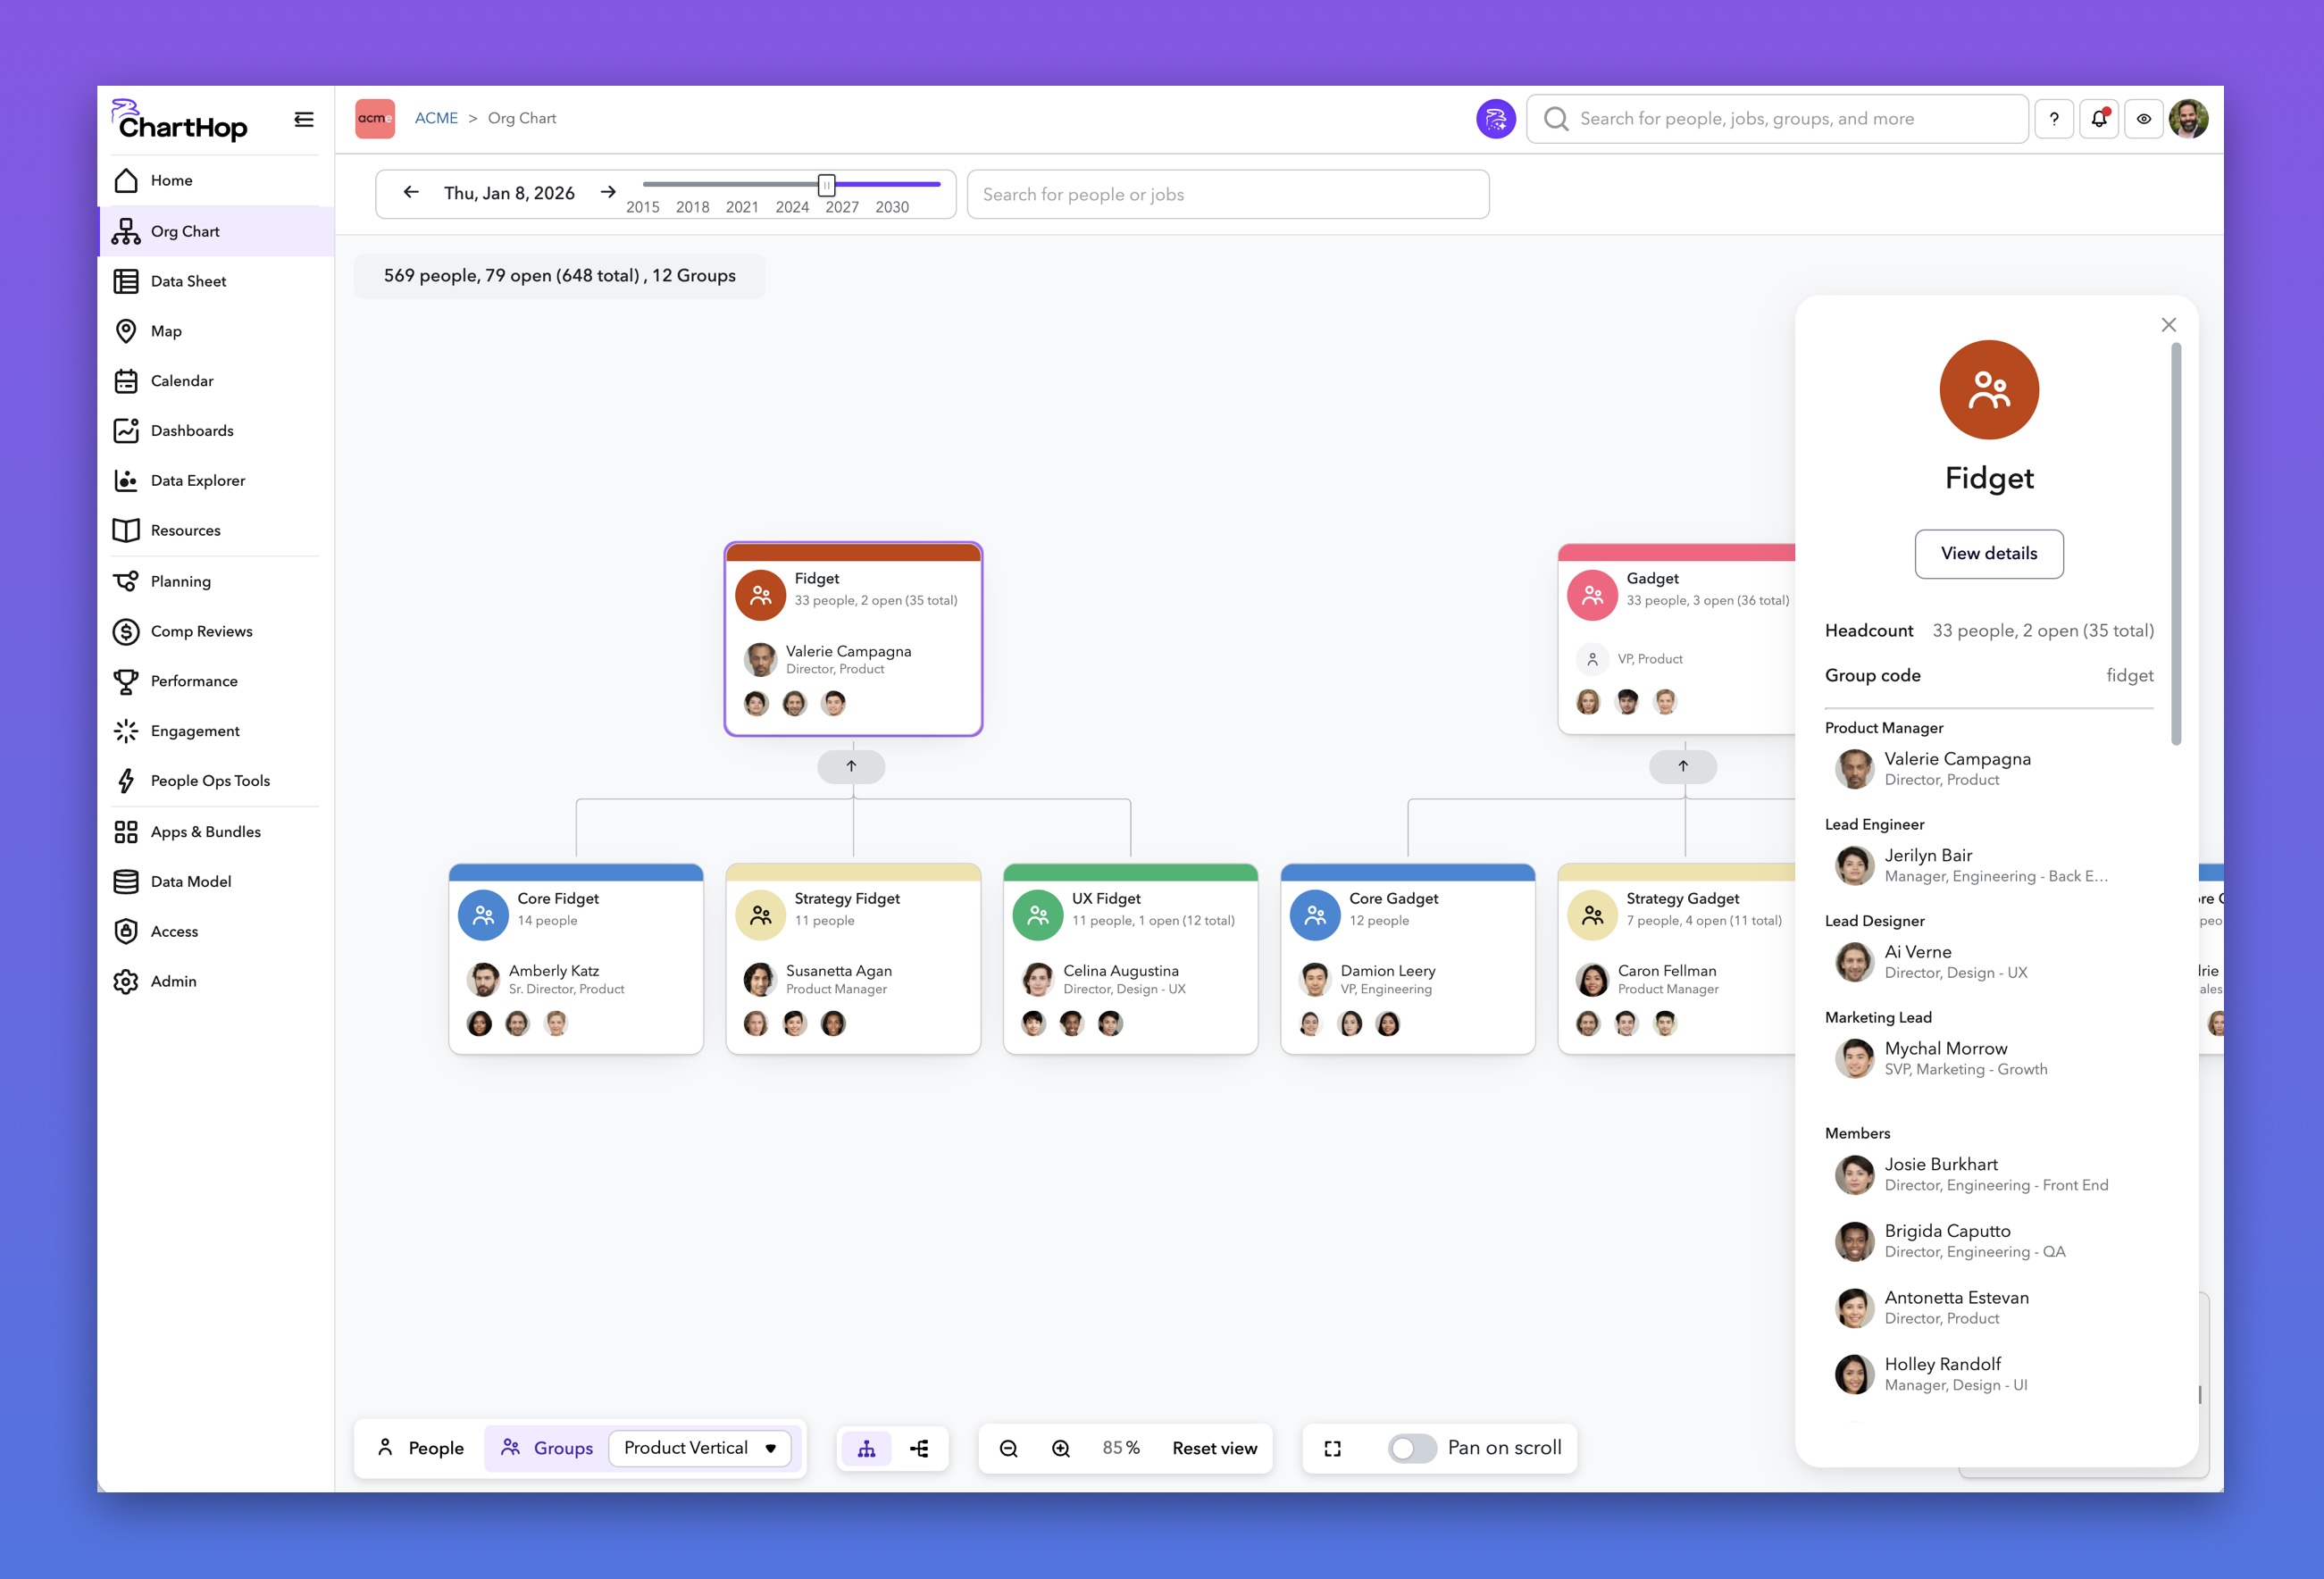
With Custom Groups and Matrix Teams, you can now reflect how work actually gets done within your organization. Create structured teams, assign custom positions, track membership history, and set granular access controls. ChartHop AI understands these groups instantly and incorporates them into every filter, dashboard, and analysis.
And the new Data Sheet (launched in December after beta testing with 90+ customers) brings true spreadsheet power directly into ChartHop: faster performance, improved formatting, column aggregate and visualized info, row numbers, expandable panels, custom calculated columns similar to spreadsheet formulas, bulk editing, improved copy/paste for back and forth transfers with spreadsheets, and keyboard navigation. To top it off, we even brought this powerful experience into Compensation Reviews with new workbooks.
In 2025, we dramatically expanded integrations with one simple purpose: eliminate scattered data and give you one trusted place to see the full organizational picture.
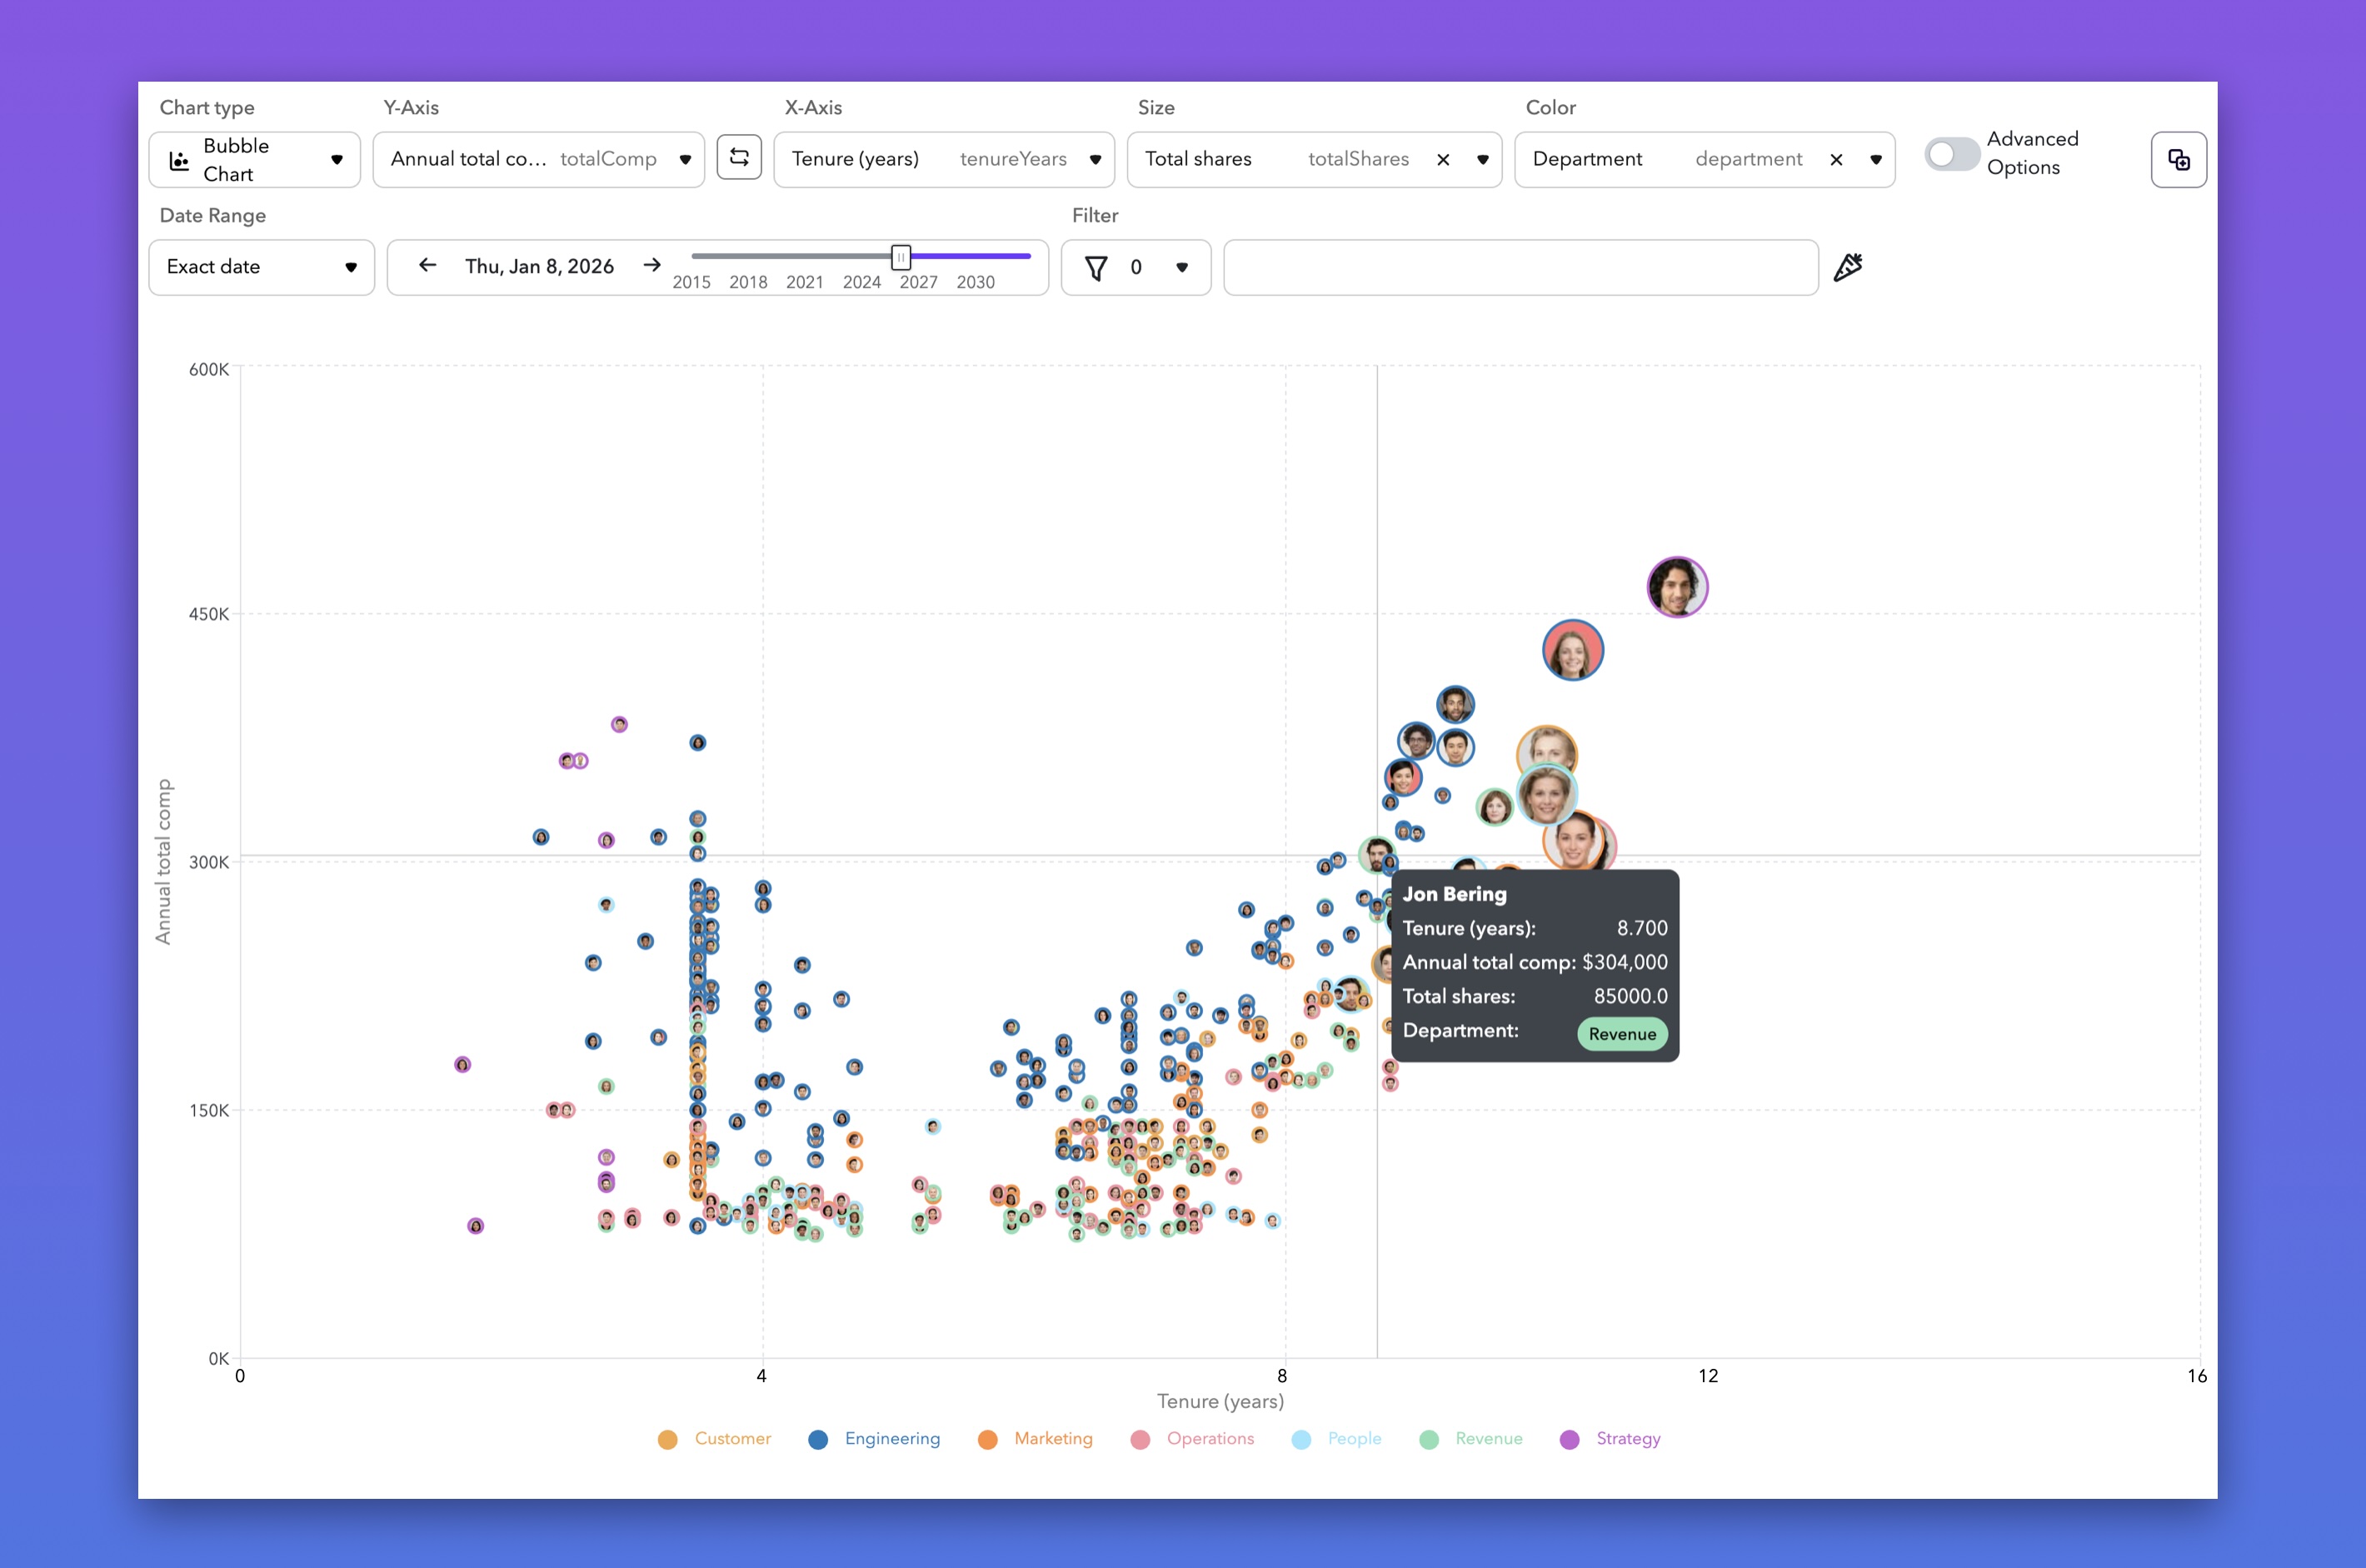
We launched Data Explorer – a full-screen interactive visualization workspace with Bubble Charts that let you analyze across three axes plus color categorization. AI-driven chart creation and drill-down tools turn complex workforce analysis into an engaging visual journey.
We added hundreds of new payroll and HCM sources. Enhanced Salesforce integration brings pipeline, revenue goals, and account data directly to responsible teams. Expanded Zendesk connects support metrics to departments and locations. Deeper Google Sheets integration lets you blend operational data with HR data instantly. New Deel inbound integration syncs global payroll automatically. Improved HiBob and UKG Ready connectors reduce duplicate entry and speed up implementation.
Here's why this matters: When people data and business data flow into ChartHop, you get true Organizational Intelligence. People teams connect headcount investments directly to revenue outcomes. Finance sees real-time budget impact. Executives can ask "Which territories are understaffed relative to pipeline?" and get immediate answers.
HR outcomes truly become business outcomes. When your people data lives alongside your business data, you stop optimizing HR in isolation and start optimizing organizational performance as a whole.
Document Management with PDF previews, built in e-signatures with optional QES compliance, collaborative calibrations for Performance, Branded homepages with custom logos, colors, and configurable widgets. Better navigation, faster approvals, stronger security. With 800 improvements, there is much more to include but we’ll wrap up… our wrap up.
We welcomed many new customers to the ChartHop family in 2025, and we listened closely to feedback from all of you to improve every part of the platform. So much of what we built came directly from conversations with our incredible customers. We see the impact you're creating within your organizations, and we're honored to be your partner.
As we look to 2026 and beyond, we remain more dedicated than ever to helping companies plan smarter, work better, and take great care of their people.
We can't wait to show you what's coming next. 🎊
– The ChartHop Team

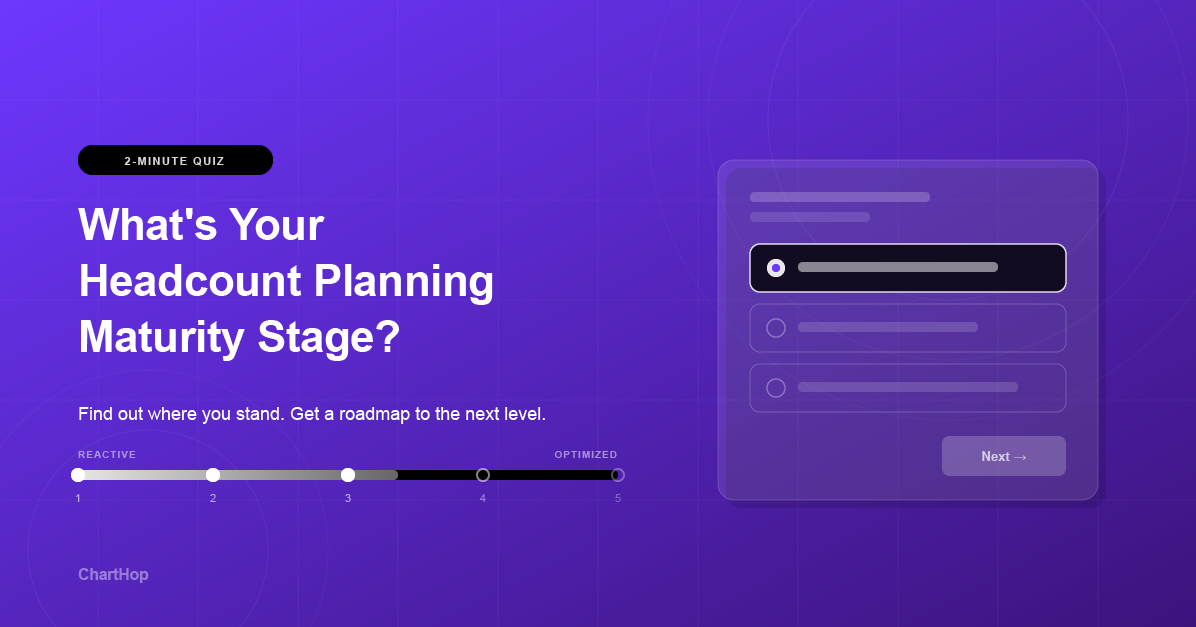

Take this 2-minute quiz to find out where your headcount planning process stands and get a personalized roadmap to improve accuracy, speed, and HR-Finance alignment.
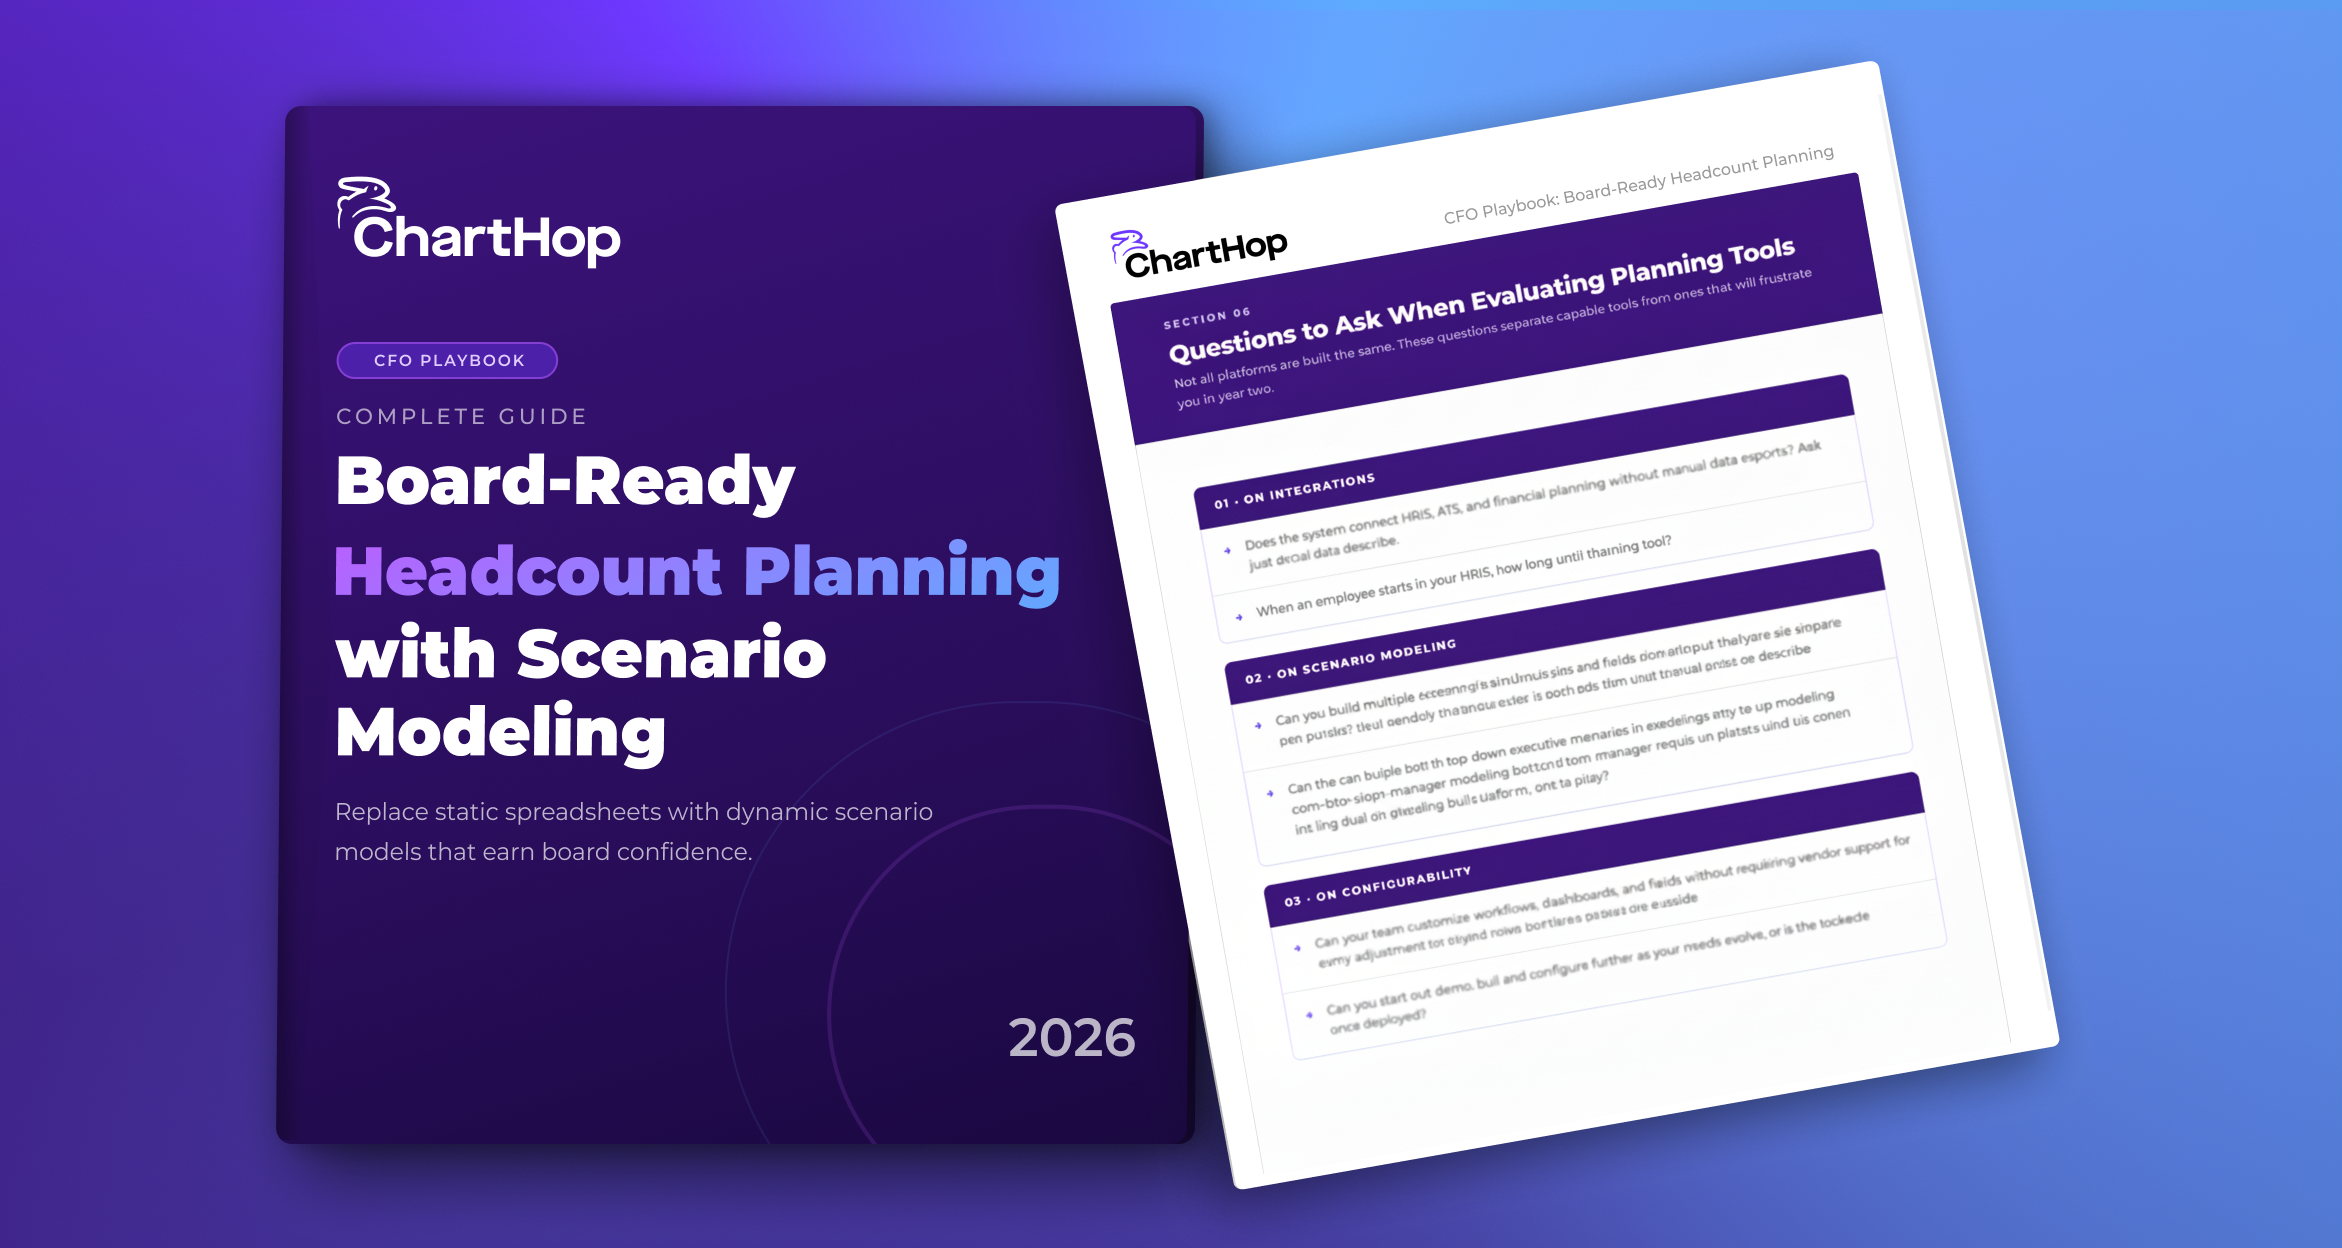
A CFO playbook for leaders who need to walk into board meetings with more than a single forecast — and leave with the board's confidence, not more questions.

See how AI-powered headcount planning helps HR and Finance teams build scenarios faster, model real-time budget impact, and make confident workforce decisions without the spreadsheets.

